Monitoring endpoints is an important aspect of system observability for diagnosing performance and availability issues. In this article, we will cover in detail how to achieve endpoint monitoring in Kubernetes using Blackbox Exporter and Prometheus.
What is a Prometheus Exporter?
Prometheus exporter is a translator that can fetch statistics from a non-prometheus system and can convert the statistics to Prometheus understandable metrics, i.e. the Prometheus exposition format.
There are a number of Prometheus exporters that are used to export existing metrics from third-party systems to Prometheus metrics, some of them are:
| Exporter Name |
Function |
| Blackbox Exporter |
Probe endpoints over HTTP/S, DNS, TCP, and ICMP |
| Redis Exporter |
Connects to Redis instance and provides Redis metrics in Prometheus readable format |
| Node Exporter |
Exposes hardware and OS metrics for *NIX kernels |
| Elasticsearch Exporter |
Connects to Elasticsearch instance and provides various Elasticsearch metrics in Prometheus readable format |
| Kube-state Metrics Exporter |
add-on agent which provides metrics about various Kubernetes objects, such as pods, nodes, and deployments |
Other exporters can be found in Exporters and integrations docs page.
What is Endpoint monitoring, why is it needed?
In the current context, endpoint monitoring refers to monitoring internal and external endpoints (HTTP/S, DNS, TCP, and ICMP) for various parameters including HTTP latencies, DNS lookup latencies, SSL certificate expiry information, TLS version.
In a Kubernetes system, not just the external endpoints that need to be monitored, internal endpoints are also required to be monitored for latency and other parameters. These metrics are an important piece of the infrastructure to ensure continuity of service and compliance with some security certifications.
WhiteBox vs BlackBox monitoring
Whitebox monitoring refers to monitoring the internals of the system including application logs, metrics from handlers. Blackbox monitoring on the other hand includes monitoring the behavior from outside that affects users like server down, page not working, or degradation of site performance.
What is Blackbox Exporter?
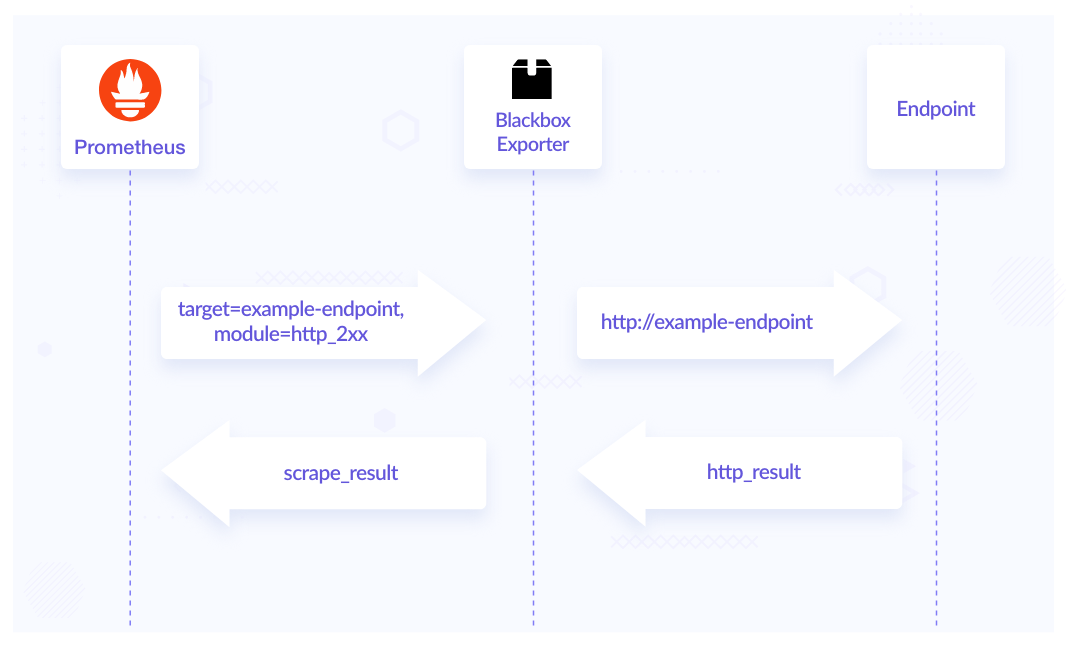
Blackbox Exporter is used to probe endpoints like HTTPS, HTTP, TCP, DNS, and ICMP. After you define the endpoint, Blackbox Exporter generates metrics that can be visualized using tools like Grafana. One of the most important feature of Blackbox Exporter is measuring the response time of endpoints.
The following diagram shows the flow of Blackbox Exporter monitoring an endpoint.
Here is a default module defined in the Blackbox Exporter config:
modules:
  http_2xx:
    http:
      fail_if_not_ssl: true
      ip_protocol_fallback: false
      method: GET
      no_follow_redirects: false
      preferred_ip_protocol: ip4
      valid_http_versions:
        - HTTP/1.1
        - HTTP/2.0
      valid_status_codes:
        - 200
        - 204
    prober: http
    timeout: 15s
The above module is http_2xx. It works on HTTP Probe offered by Blackbox Exporter. Here we have also added valid_status_codes for the probe to return success for the endpoints returning various status codes. You can accordingly configure your blackbox.yml to make the probe return success/failure based on your configurations. Other configuration parameters can be found below:
| Parameter |
Function |
| valid_status_codes: |
List of status codes for the probe to return success for your applications |
| method: GET |
Use of HTTP GET to access the endpoint |
| no_follow_redirects: false |
Do not follow HTTP redirects |
| preferred_ip_protocol: ip4 |
Use IPv4 protocol |
| valid_http_versions |
Both HTTP/1.1 and HTTP/2.0 are valid |
| timeout: 15s |
Timeout after 15s if no response received |
| fail_if_not_ssl: true |
The probe will fail if the endpoint is not SSL secured |
You can have a look at the detailed example for more scenarios in this example.yml. With some config changes on the Prometheus side, the Blackbox Exporter then sends metrics relevant to the configs applied, we will see this in more detail in the coming sections.
Why do we need Blackbox Exporter?
There are various tools available for monitoring endpoints like Datadog, Freshping, Uptime.com, etc.
In a production infrastructure with multiple services and endpoints, the regular endpoint monitoring solutions like Datadog monetarily cost us hefty amounts even for small probe checks, Blackbox Exporter in this case is an open-source alternative to available solutions and is maintained by the Prometheus community.
One point to be noted is that most exporters accept static configurations and expose metrics, Blackbox Exporter works a little differently. Inside the config, you define modules, then Prometheus can query each of the modules for a set of targets. As a response to that query, Blackbox Exporter generates metrics for the queried endpoint. This means we do not have to manually change the endpoints, Prometheus and Blackbox Exporter takes care of generating the endpoints dynamically with the help of Prometheus’ kubernetes_sd_configs functionality.
In small deployments and infrastructure, a static list is easy to maintain, it is very easy to forget about updating that list once you have multiple clusters and environments, maintenance of such monitoring solutions becomes very cumbersome.
Installing and Configuring Blackbox Exporter in Kubernetes
How do you install Blackbox Exporter?
We will be using the prometheus-community/prometheus-blackbox-exporter Helm chart to install Blackbox Exporter, it can be found in prometheus-blackbox-exporter.
You can add the modules for blackbox.yml in the values.yml config section:
config:
  modules:
    http_2xx:
      prober: http
      timeout: 5s
      http:
        valid_http_versions: ["HTTP/1.1", "HTTP/2.0"]
        follow_redirects: true
        preferred_ip_protocol: "ip4"
$ helm repo add prometheus-community https://prometheus-community.github.io/helm-charts
$ helm repo update
$ helm install prometheus-blackbox prometheus-community/prometheus-blackbox-exporter -f values.yaml
Prometheus is a prerequisite for Blackbox Exporter, we will be using Prometheus Operator to install Prometheus. You can install/know more about Prometheus Operator from InfraCloud’s prometheus-operator-helm-guide.
We will be editing the prometheus.yml by adding the configurations. If you have installed the Prometheus Operator using kube-prometheus-stack chart, then you can add the configuration under additionalScrapeConfigs[] in values.yml.
Note: Prometheus Operator also has a Probe Custom Resource, which can be used to configure Prometheus with Blackbox Exporter. At the time of writing this article, it only supports dynamic discovery for Ingress resource.
We will majorly be adding configs for the following in Prometheus for our endpoint monitoring.
- Probing external targets
- Probing services via the Blackbox Exporter
- Probing ingresses via the Blackbox Exporter
- Probing pods via Blackbox Exporter
In the kube-prometheus-stack’s values.yaml, add the following blocks under additionalScrapeConfigs[] section:
1. Add Prometheus config to probe external targets
We can probe certain static targets from Prometheus with the help of Blackbox Exporter using static_configs.
- job_name: 'blackbox-external-targets'
  metrics_path: /probe
  params:
    module: [http_2xx]
  static_configs:
    - targets:
      - https://www.google.com
  relabel_configs:
    - source_labels: [__address__]
      target_label: __param_target
    - source_labels: [__param_target]
      target_label: instance
    - target_label: __address__
      replacement: prometheus-blackbox-prometheus-blackbox-exporter:9115
The __param_target label tells Prometheus to set the target query param to the given value, which is the target’s address, in this case, i.e. google.com.
In Kubernetes, external targets can be used in some scenarios to test the third-party service’s performance, in checking some performance tools latency issues.
But in a Kubernetes system where resources and endpoints come and go over time, the probing which can be highly useful is the dynamic probing of resources including pods, services, and ingress.
Using Kubernetes service discovery configs in Prometheus, we can achieve the dynamic probing of endpoints. Kubernetes service discovery configurations allow fetching scrape targets from Kubernetes’ API and always stays synchronized with the cluster state.
You can find the list of available roles that can be configured to discover targets in the kubernetes_sd_config section of the documentation.
2. Add Prometheus config to probe services
    - job_name: "blackbox-kubernetes-services"
      metrics_path: /probe
      params:
        module: [http_2xx]
      kubernetes_sd_configs:
      - role: service
      relabel_configs:
      # Example relabel to probe only some services that have "example.io/should_be_probed = true" annotation
      #  - source_labels: [__meta_kubernetes_service_annotation_example_io_should_be_probed]
      #    action: keep
      #    regex: true
        - source_labels: [__address__]
          target_label: __param_target
        - target_label: __address__
          replacement:  prometheus-blackbox-prometheus-blackbox-exporter:9115
        - source_labels: [__param_target]
          target_label: instance
        - action: labelmap
          regex: __meta_kubernetes_service_label_(.+)
        - source_labels: [__meta_kubernetes_namespace]
          target_label: kubernetes_namespace
        - source_labels: [__meta_kubernetes_service_name]
          target_label: kubernetes_service_name
Here we can use [__meta_kubernetes_service_annotation_example_io_should_be_probed] to only check those services that have the annotation example.io/should_be_probed = true.
3. Add Prometheus config to probe ingress
    - job_name: "blackbox-kubernetes-ingresses"
      metrics_path: /probe
      params:
        module: [http_2xx]
      kubernetes_sd_configs:
      - role: ingress
      relabel_configs:
      # Example relabel to probe only some ingresses that have "example.io/should_be_probed = true" annotation
      #  - source_labels: [__meta_kubernetes_ingress_annotation_example_io_should_be_probed]
      #    action: keep
      #    regex: true
        - source_labels:
            [
              __meta_kubernetes_ingress_scheme,
              __address__,
              __meta_kubernetes_ingress_path,
            ]
          regex: (.+);(.+);(.+)
          replacement: ${1}://${2}${3}
          target_label: __param_target
        - target_label: __address__
          replacement: prometheus-blackbox-prometheus-blackbox-exporter:9115
        - source_labels: [__param_target]
          target_label: instance
        - action: labelmap
          regex: __meta_kubernetes_ingress_label_(.+)
        - source_labels: [__meta_kubernetes_namespace]
          target_label: kubernetes_namespace
        - source_labels: [__meta_kubernetes_ingress_name]
          target_label: ingress_name
4. Add Prometheus config to probe pods
    - job_name: "blackbox-kubernetes-pods"
      metrics_path: /probe
      params:
        module: [http_2xx]
      kubernetes_sd_configs:
      - role: pod
      relabel_configs:
      # Example relabel to scrape only pods that have
      # "example.io/should_be_scraped = true" annotation.
      #  - source_labels: [__meta_kubernetes_pod_annotation_example_io_should_be_scraped]
      #    action: keep
      #    regex: true
        - source_labels: [__address__]
          target_label: __param_target
        - target_label: __address__
          replacement:  prometheus-blackbox-prometheus-blackbox-exporter:9115
        - source_labels: [__param_target]
          replacement: ${1}/health
          target_label: instance
        - action: labelmap
          regex: __meta_kubernetes_pod_label_(.+)
        - source_labels: [__meta_kubernetes_namespace]
          target_label: kubernetes_namespace
        - source_labels: [__meta_kubernetes_pod_name]
          target_label: kubernetes_pod_name
Considering our application which exposes health of the application at /health endpoint, we have used replacement directive for source_label.
Verify the generated metrics in Prometheus
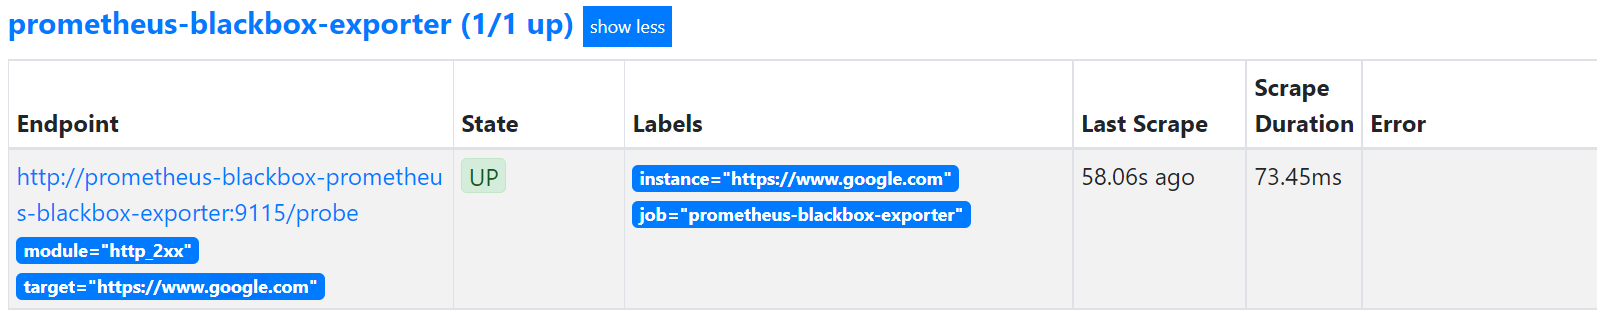
Once the changes are applied and the resources for the Blackbox Exporter are deployed, we can verify the status of targets in Prometheus. We can check whether the Blackbox Exporter is up with the registered targets by navigating to the Status tab and then selecting Targets in the Prometheus UI.
Here you can see we are using https://www.google.com as an external target for reference with its state UP.
We can also check if metrics are getting populated by looking for metrics starting with probe_
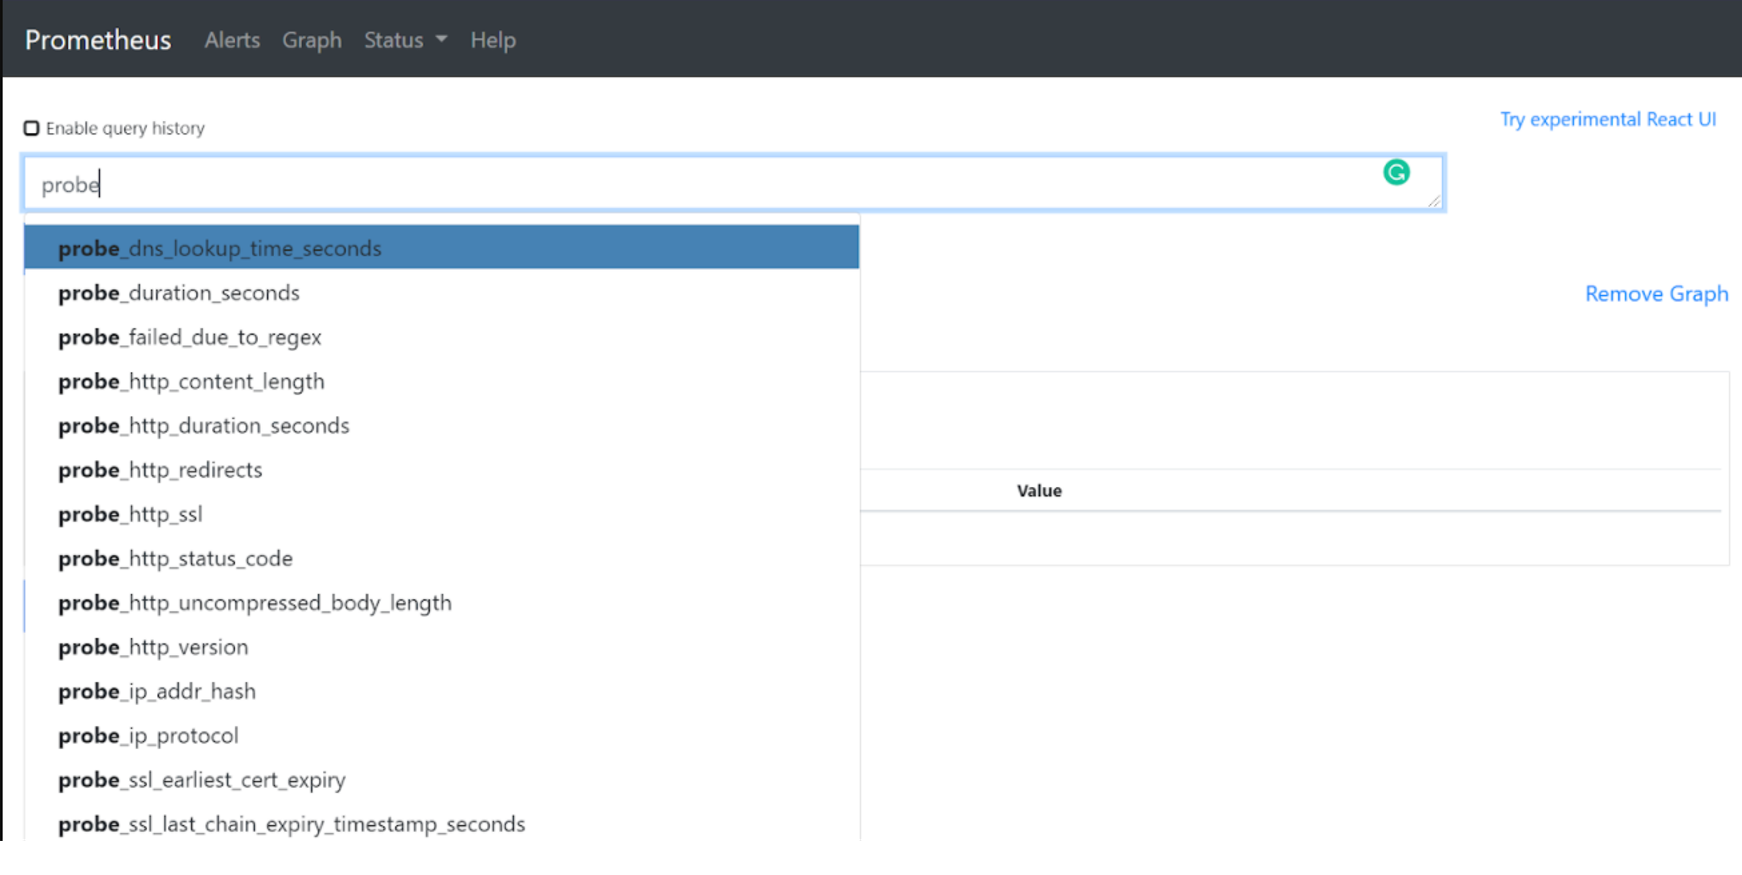
Here you can see the list of some of the generated probe_ metrics:
| Metric name |
Function |
| probe_duration_seconds |
Returns how long the probe took to complete in seconds |
| probe_http_status_code |
Response HTTP status code |
| probe_http_version |
Returns the version of HTTP of the probe response |
| probe_success |
Displays whether or not the probe was a success |
| probe_dns_lookup_time_seconds |
Returns the time taken for probe DNS lookup in seconds |
| probe_ip_protocol |
Specifies whether probe ip protocol is IP4 or IP6 |
| probe_ssl_earliest_cert_expiry metric |
Returns earliest SSL cert expiry in unixtime |
| probe_tls_version_info |
Contains the TLS version used |
| probe_failed_due_to_regex |
Indicates if probe failed due to regex |
| probe_http_content_length |
Length of HTTP content response |
| probe_http_version |
Returns the version of HTTP of the probe response |
We can now use the generated metrics with Grafana to create our custom dashboards. However, there are some already available dashboards on Grafana that can be imported to visualize data from the generated metrics, some of them are:
How did Blackbox Exporter reveal our infrastructure discrepancies?
In this section we will see how we used Blackbox Exporter to probe external targets and some other scenarios where it can be used to probe ingress,pods and services:
External target
We were facing increased latencies in our application performance, and we were not sure which endpoint is causing the problem. We monitored the response time of all endpoints which were being used in the application flow, and with the help of BlackBox Exporter we found our latency causing endpoints.
Let us assume a scenario where we have two Kubernetes services A and B. Service A calls another service B, service B then calls some external endpoints for response, processes it, and sends it back to service A. The external endpoints can be user facing endpoints, third party services, or database endpoints. For reference, we are monitoring google.com as an external endpoint here.
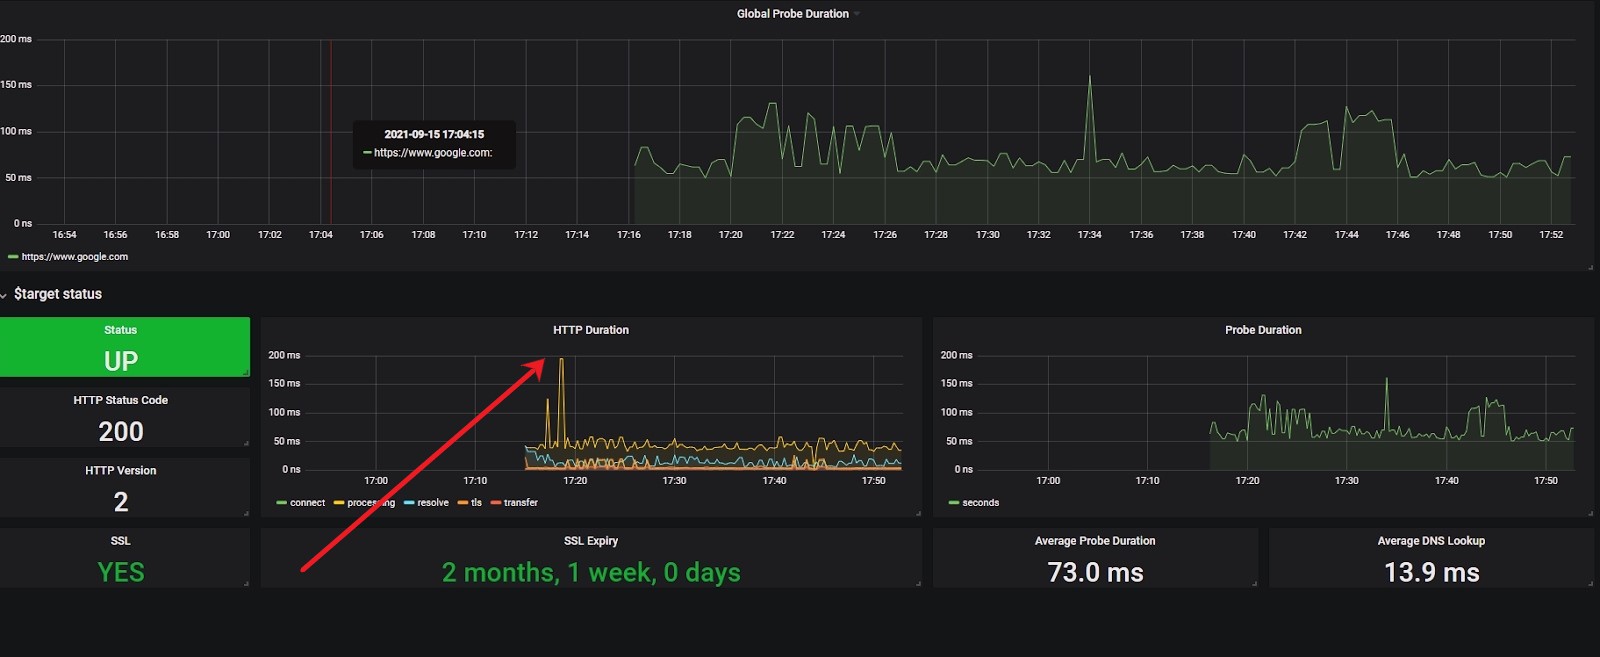
In the above dashboard example, we can see that we can now monitor the website performance by measuring its response time using probe_http_duration_seconds metrics generated by the Blackbox Exporter, and look for the spike in the external targets that caused the latency in services A and B.
Ingress
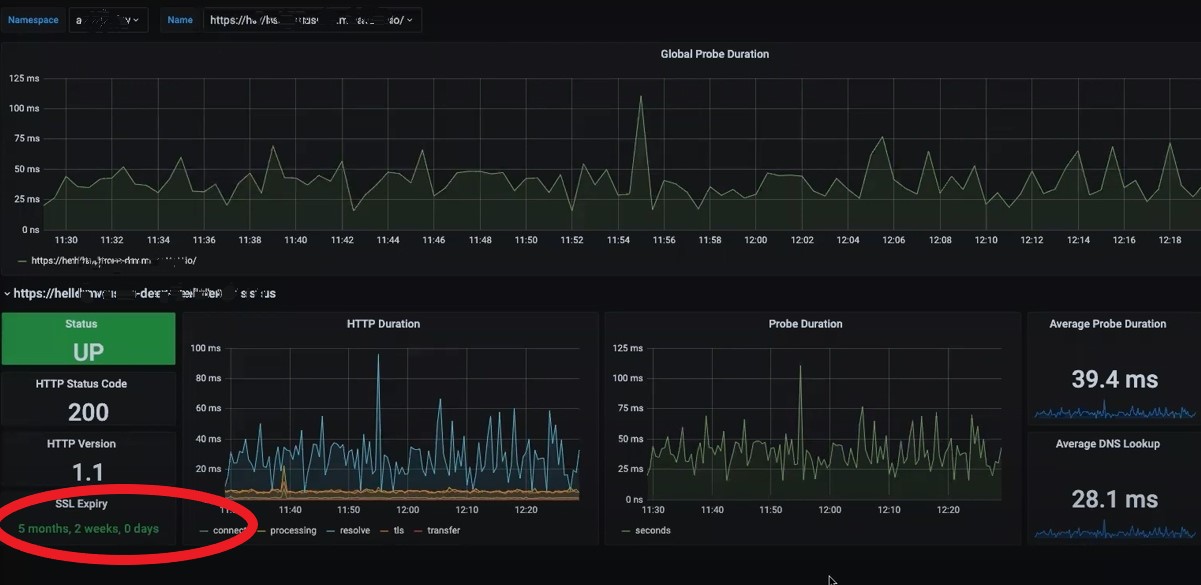
In this scenario we will be focusing on the problem regarding certificate expiry, if we want to monitor when our domain certificate is going to expire, we can achieve this by using probe_ssl_earliest_cert_expiry metric generated by Blackbox Exporter for our ingress resources. We can also use it to monitor if DNS resolution is working, or if there is any latency/issues from the loadbalancer side.
Pods
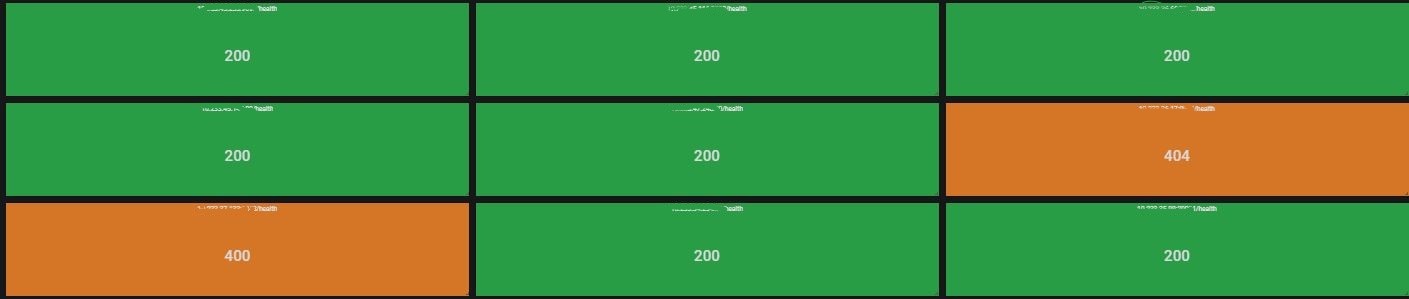
We can probe pods and create health dashboard for our applications, in the above example we can see we are probing the pod on /health endpoint by using probe_http_status_code metrics generated by Blackbox Exporter.
Service
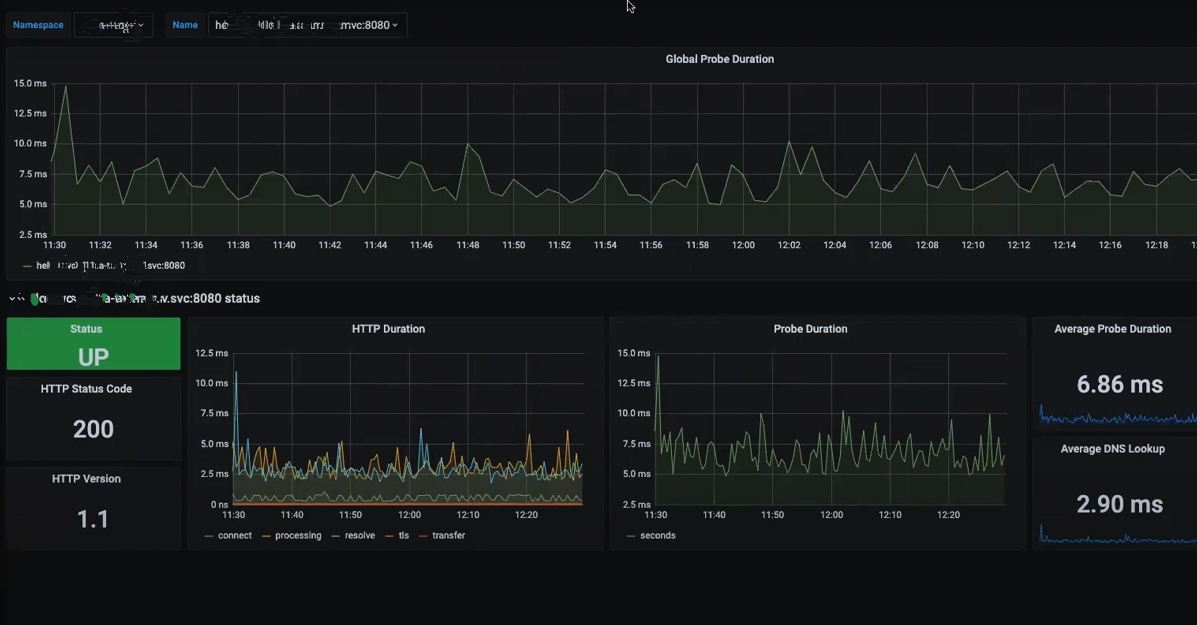
We can also monitor if services are properly configured and are responding to probe checks.
Benefits of Blackbox Exporter
In the above examples, we can see how we can use Blackbox Exporter for some common scenarios in a Kubernetes cluster. Overall, we can say Blackbox Exporter can be used in the following scenarios:
- Measuring response time is the most important feature of the Blackbox Exporter, in such cases, it can be considered as an excellent tool for analyzing the latency/reachability of endpoints including our user-facing endpoints and third-party services.
- Provides dynamic endpoint monitoring from within the Kubernetes cluster. Most exporters accept static configurations and expose metrics, Blackbox Exporter works differently, and along with the support of static configs/endpoints it can produce metrics dynamically by using Prometheus’ kubernetes_sd_config functionality and can be used in dynamic endpoint monitoring.
- Blackbox Exporter can be used to detect endpoint failures and health checks, it can be integrated with Alertmanager (We can add alert rules to the Prometheus to receive alerts about Blackbox Exporter).
- We can always stay updated by monitoring the certificate expiry date of endpoints using Blackbox Exporter.
Conclusion
In this article, we covered the following points:
- What is Blackbox Exporter, why it is needed.
- How to install and use Blackbox Exporter with a Kubernetes cluster and monitor it using Grafana.
- What are some important use cases/benefits of Blackbox Exporter.
This post introduced you to Blackbox Exporter for endpoint monitoring of a Kubernetes cluster for infrastructure reliability. I hope you found this post informative and engaging. For more posts like this one, do subscribe to our weekly newsletter. I’d love to hear your thoughts on this post, so do start a conversation on LinkedIn :).
Looking for help with observability stack implementation and consulting? do check out how we’re helping startups & enterprises as an observability consulting services provider.
References and further reading