In earlier days, it was easy to deduct and debug a problem in monolithic applications because there was only one service running in the backend and front end. Now, we are moving towards the microservices architecture, where applications are divided into multiple independently deployable services. These services have their own goal and logic to serve. In this kind of application architecture, it becomes difficult to observe how one service depends on or affects other services.
To make the system observable, some logs, metrics, or traces must be emitted from the code, and this data must be sent to an observability backend. This is where OpenTelemetry and Jaeger come into the picture.
In this blog post, we will see how to monitor application trace data (Traces and Spans) with the help of OpenTelemetry and Jaeger. Trace is used to observe the requests as they propagate through the services in a distributed system and Spans is a basic unit of the trace; it represents a single event within the trace, and a trace can have one or multiple spans. A span consists of log messages, time-related data, and other attributes to provide information about the operation it tracks.
We will use the distributed tracing method to observe requests moving across microservices, generating data about the request and making it available for analysis. The produced data will have a record of the flow of requests in our microservices, and it will help us understand our application’s performance.
OpenTelemetry
Telemetry is the collection and transmission of data using agents and protocols from the source in observability. The telemetry data includes logs, metrics, and traces, which help us understand what is happening in our application.
OpenTelemetry (also known as OTel) is an open source framework comprising a collection of tools, APIs, and SDKs. OpenTelemetry makes generating, instrumenting, collecting, and exporting telemetry data easy. The data collected from OpenTelemetry is vendor-agnostic and can be exported in many formats. OpenTelemetry is formed after merging two projects OpenCensus and OpenTracing.
Instrumenting
The process of adding observability code to your application is known as instrumentation. Instrumentation helps make our application observable, meaning the code must produce some metrics, traces, and logs.
OpenTelemetry provides two ways to instrument our code:
- Manual Instrumentation
- Auto Instrumentation
1. Manual Instrumentation
The user needs to add an OpenTelemetry code to the application. The manual instrumentation provides more options for customization in spans and traces. Languages supported for manual instrumentations are - C++, .NET, Go, Java, Python, etc.
2. Automatic Instrumentation
It is the easiest way of instrumentation as it requires no code changes and no need to recompile the application. It uses an intelligent agent that gets attached to an application, reads its activity, and extracts the traces. Automatic instrumentation supports Java, NodeJS, Python, etc.
Difference between Manual and Automatic Instrumentation.
Both manual and automatic instrumentation have advantages and disadvantages that you might consider while writing your code. A few of them are listed below:
| Manual Instrumentation |
Automatic Instrumentation |
| Code Changes are required. |
Code Changes are not required. |
| It supports maximum programming languages. |
Currently, .Net, Java, NodeJS and Python are supported. |
| It consumes a lot of time as code changes are required. |
Easy to implement as we do not need to touch the code. |
| Provide more options for the customization of spans and traces. As you have more control over the telemetry data generated by your application. |
Fewer options for customization. |
| Possibilities of error are high as manual changes are required. |
No error possibilities. As we don’t have to touch our application code. |
To make the instrumentation process hassle-free, use automatic instrumentation as it does not require any modification in the code and reduces the possibility of errors. Automatic instrumentation is done by an agent which reads your application’s telemetry data, so no manual changes are required.
For the scope of this post, we will see how you can use automatic instrumentation in a Kubernetes-based microservices environment.
Jaeger
Jaeger is a distributed tracing tool initially built by Uber and released as open source in 2015. Jaeger is also a Cloud Native Computing Foundation graduate project and was influenced by Dapper and OpenZipkin. It is used for monitoring and troubleshooting microservices-based distributed systems.
The Jaeger components which we have used for this blog are:
- Jaeger Collector
- Jaeger Query
- Jaeger UI / Console
- Storage Backend
Jaeger Collector: The Jaeger distributed tracing system includes the Jaeger collector. It is in charge of gathering and keeping the information. After receiving spans, the collector adds them to a processing queue. Collectors need a persistent storage backend, hence Jaeger also provides a pluggable span storage mechanism.
Jaeger Query: Is a service used to get traces out of storage. The web-based user interface for the Jaeger distributed tracing system is called Jaeger Query. It provides various features and tools to help you understand the performance and behaviour of your distributed application and enables you to search, filter, and visualise the data gathered by Jaeger.
Jaeger UI / Console: Jaeger UI lets you view and analyse traces generated by your application.
Storage Backend: Is used to store the traces generated by an application for the long term. In this post, we are going to use Elasticsearch to store the traces.
What is the need for integrating OpenTelemetry with Jaeger?
OpenTelemetry and Jaeger are the tools that help us in setting the observability in microservices-based distributed systems, but they are intended to address different issues.
The primary difference between OpenTelemetry and Jeger is that OpenTelemetry provides an instrumentation layer for the application, which helps us generate, collect, and export the telemetry data for analysis, while Jaeger is used to store and visualize telemetry data.
OpenTelemetry can only generate and collect the data. It does not have a UI for the visualization. So we need to integrate Jaeger with OpenTelemetry as it has a storage backend and a web UI for the visualization of the telemetry data. With the help of Jaeger UI, we can quickly troubleshoot microservices-based distributed systems.
Note: OpenTelemetry can generate logs, metrics, and traces. Jaeger does not support logs and metrics.
Now you have an idea about OpenTelemetry and Jaeger. Let’s see how we can Integrate them with each other to visualize the traces and spans generated by our application.
Implementing OpenTelemetry auto-instrumentation
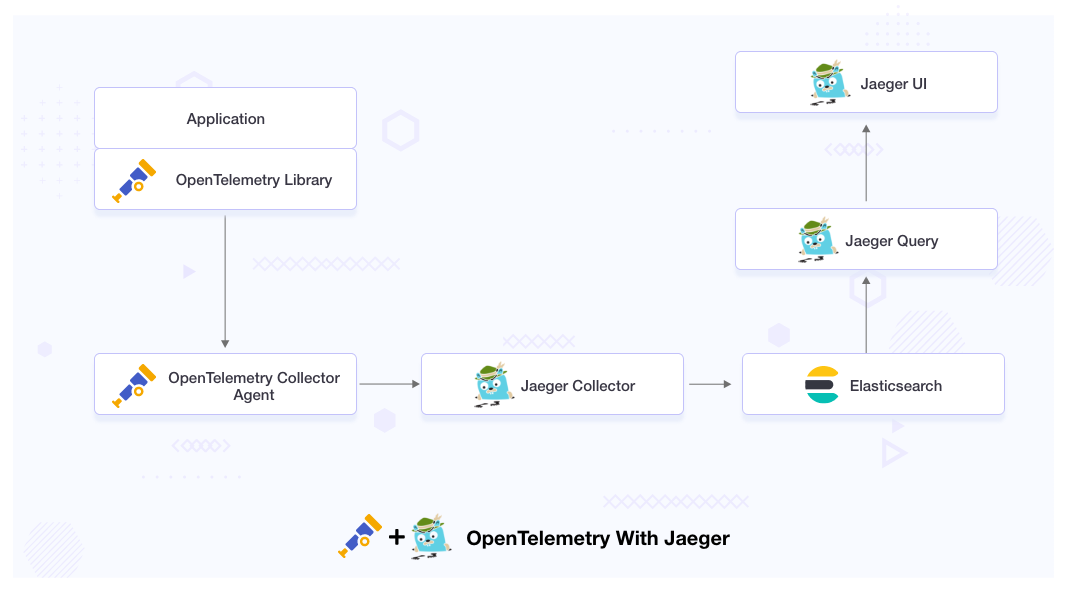
We will integrate OpenTelemetry with Jaeger, where OpenTelemetry will act as an instrumentation layer for our application, and Jaeger will act as the backend analysis tool to visualize the trace data.
Jaeger will get the telemetry data from the OpenTelemetry agent. It will store the data in the storage backend, from where we will query the stored data and visualize it in the Jaeger UI.
Prerequisites for this blog are:
- The target Kubernetes cluster is up and running.
- You have access to run the
kubectl command against the Kubernetes cluster to deploy resources.
- Cert manager is installed and running. You can install it from the website cert-manager.io if it is not installed.
We assume that you have all the prerequisites and now you are ready for the installation. The files we have used for this post are available in this GitHub repo.
Installation
The Installation part contains 3 Steps:
- Elasticsearch Installation
- Jaeger Installation
- OpenTelemetry Installation
Elasticsearch
By default, Jaeger uses in-memory storage to store spans, which is not a recommended approach for the production environment. There are various tools available to use as a storage backend in Jaeger; you can read about them in the official documentation of Jaeger span storage backend.
In this blog post, we will use Elasticsearch as a storage backend. You can deploy Elasticsearch in your Kubernetes cluster using the Elasticsearch Helm chart. While deploying Elasticsearch, ensure you have enabled the password-based authentication and deploy that Elasticsearch in observability namespaces.
Elasticsearch is deployed in our Kubernetes cluster, and you can see the output by running the following command.
$ kubectl get all -n observability

NAME                            READY   STATUS    RESTARTS   AGE
pod/elasticsearch-0             1/1     Running   0          17m

NAME                            TYPE           CLUSTER-IP       EXTERNAL-IP          PORT(S)           AGE
service/elasticsearch         ClusterIP          None            <none>         9200/TCP,9300/TCP      17m

NAME                             READY   AGE
statefulset.apps/elasticsearch   1/1     17m
Jaeger Installation
We are going to use Jaeger to visualize the trace data. Let’s deploy the Jaeger Operator on our cluster.
Before proceeding with the installation, we will deploy a ConfigMap in the observability namespace. In this ConfigMap, we will pass the username and password of the Elasticsearch which we have deployed in the previous step. Replace the credentials based on your setup.
kubectl -n observability apply -f - <<EOF
apiVersion: v1
kind: ConfigMap
metadata:
  name: jaeger-configuration
  labels:
    app: jaeger
    app.kubernetes.io/name: jaeger
data:
  span-storage-type: elasticsearch
  collector: |
    es:
      server-urls: http://elasticsearch:9200
      username: elastic
      password: changeme
    collector:
      zipkin:
        http-port: 9411
  query: |
    es:
      server-urls: http://elasticsearch:9200
      username: elastic
      password: changeme
  agent: |
    collector:
      host-port: "jaeger-collector:14267"
EOF
If you are going to deploy the Jaeger in another namespace and you have changed the Jaeger collector service name, then you need to change the values of the host-port value under the agent collector.
Jaeger Operator
The Jaeger Operator is a Kubernetes operator for deploying and managing Jaeger, an open source, distributed tracing system. It works by automating the deployment, scaling, and management of Jaeger components on a Kubernetes cluster. The Jaeger Operator uses custom resources and custom controllers to extend the Kubernetes API with Jaeger-specific functionality. It manages the creation, update, and deletion of Jaeger components, such as the Jaeger collector, query, and agent components. When a Jaeger instance is created, the Jaeger Operator deploys the necessary components and sets up the required services and configurations.
We are going to deploy the Jaeger Operator in the observability namespace. Use the below-mentioned command to deploy the operator.
$ kubectl create -f https://github.com/jaegertracing/jaeger-operator/releases/download/v1.38.0/jaeger-operator.yaml -n observability
We are using the latest version of Jaeger, which is 1.38.0 at the time of writing this article.
By default, the Jaeger script is provided for cluster-wide mode. Suppose you want to watch only a particular namespace. In that case, you need to change the ClusterRole to Role and ClusterBindingRole to RoleBinding in the operator manifest and set the WATCH_NAMESPACE env variable on the Jaeger Operator deployment.
To verify whether Jaeger is deployed successfully or not, run the following command:
$ kubectl get all -n observability

NAME                                    READY   STATUS    RESTARTS   AGE
pod/elasticsearch-0                     1/1     Running   0          17m
pod/jaeger-operator-5597f99c79-hd9pw    2/2     Running   0          11m

NAME                                      TYPE           CLUSTER-IP       EXTERNAL-IP             PORT(S)                  AGE
service/elasticsearch                     ClusterIP      None             <none>              9200/TCP,9300/TCP            17m
service/jaeger-operator-metrics           ClusterIP      172.20.220.212   <none>                 8443/TCP                  11m
service/jaeger-operator-webhook-service   ClusterIP      172.20.224.23    <none>                 443/TCP                   11m


NAME                               READY   UP-TO-DATE   AVAILABLE   AGE
deployment.apps/jaeger-operator     1/1        1            1       11m

NAME                                          DESIRED   CURRENT   READY   AGE
replicaset.apps/jaeger-operator-5597f99c79       1         1        1     11m

NAME                             READY   AGE
statefulset.apps/elasticsearch   1/1     17m
As we can see in the above output, our Jaeger Operator is deployed successfully, and all of its pods are up and running; this means Jaeger Operator is ready to install the Jaeger instances (CRs). The Jaeger instance will contain Jaeger components (Query, Collector, Agent ); later, we will use these components to query OpenTelemetry metrics.
Jaeger Instance
A Jaeger Instance is a deployment of the Jaeger distributed tracing system. It is used to collect and store trace data from microservices or distributed applications, and provide a UI to visualize and analyze the trace data. To deploy the Jaeger instance, use the following command.
$ kubectl apply -f https://raw.githubusercontent.com/infracloudio/Opentelemertrywithjaeger/master/jaeger-production-template.yaml
To verify the status of the Jaeger instance, run the following command:
$ kubectl get all -n observability

NAME                                    READY   STATUS    RESTARTS   AGE
pod/elasticsearch-0                     1/1     Running   0          17m
pod/jaeger-agent-27fcp                  1/1     Running   0          14s
pod/jaeger-agent-6lvp2                  1/1     Running   0          15s
pod/jaeger-collector-69d7cd5df9-t6nz9   1/1     Running   0          19s
pod/jaeger-operator-5597f99c79-hd9pw    2/2     Running   0          11m
pod/jaeger-query-6c975459b6-8xlwc       1/1     Running   0          16s

NAME                                      TYPE           CLUSTER-IP       EXTERNAL-IP             PORT(S)                                AGE
service/elasticsearch                     ClusterIP      None             <none>              9200/TCP,9300/TCP                          17m
service/jaeger-collector                  ClusterIP      172.20.24.132    <none>             14267/TCP,14268/TCP,9411/TCP,14250/TCP      19s
service/jaeger-operator-metrics           ClusterIP      172.20.220.212   <none>                    8443/TCP                             11m
service/jaeger-operator-webhook-service   ClusterIP      172.20.224.23    <none>                    443/TCP                              11m
service/jaeger-query                      LoadBalancer   172.20.74.114    a567a8de8fd5149409c7edeb54bd39ef-365075103.us-west-2.elb.amazonaws.com   80:32406/TCP                   16s
service/zipkin                            ClusterIP      172.20.61.72     <none>                 9411/TCP                                 18s

NAME                          DESIRED   CURRENT   READY   UP-TO-DATE   AVAILABLE   NODE SELECTOR   AGE
daemonset.apps/jaeger-agent      2         2         2       2            2           <none>       16s

NAME                               READY   UP-TO-DATE   AVAILABLE   AGE
deployment.apps/jaeger-collector    1/1     1            1          21s
deployment.apps/jaeger-operator     1/1     1            1          11m
deployment.apps/jaeger-query        1/1     1            1          18s

NAME                                          DESIRED   CURRENT   READY   AGE
replicaset.apps/jaeger-collector-69d7cd5df9     1         1         1     21s
replicaset.apps/jaeger-operator-5597f99c79      1         1         1     11m
replicaset.apps/jaeger-query-6c975459b6         1         1         1     18s

NAME                             READY   AGE
statefulset.apps/elasticsearch    1/1    17m
As we can see in the above screenshot our Jaeger instance is up and running.
OpenTelemetry
To install the OpenTelemetry, we need to install the OpenTelemetry Operator. The OpenTelemetry Operator uses custom resources and custom controllers to extend the Kubernetes API with OpenTelemetry-specific functionality, making it easier to deploy and manage the OpenTelemetry observability stack in a Kubernetes environment.
The operator manages two things:
-
Collectors: It offers a vendor-agnostic implementation of how to receive, process and export telemetry data.
-
Auto-instrumentation of the workload using OpenTelemetry instrumentation libraries. It does not require the end-user to modify the application source code.
OpenTelemetry operator
To implement the auto-instrumentation, we need to deploy the OpenTelemetry operator on our Kubernetes cluster. To deploy the k8s operator for OpenTelemetry, follow the K8s operator documentation
You can verify the deployment of the OpenTelemetry operator by running the below-mentioned command:
$ kubectl get all -n  opentelemetry-operator-system

NAME                                                             READY   STATUS    RESTARTS    AGE
pod/opentelemetry-operator-controller-manager-7f479c786d-zzfd8    2/2    Running      0        30s

NAME                                                                TYPE        CLUSTER-IP       EXTERNAL-IP   PORT(S)    AGE
service/opentelemetry-operator-controller-manager-metrics-service   ClusterIP   172.20.70.244    <none>        8443/TCP   32s
service/opentelemetry-operator-webhook-service                      ClusterIP   172.20.150.120   <none>        443/TCP    31s

NAME                                                        READY   UP-TO-DATE   AVAILABLE      AGE
deployment.apps/opentelemetry-operator-controller-manager    1/1        1            1          31s

NAME                                                                   DESIRED   CURRENT   READY    AGE
replicaset.apps/opentelemetry-operator-controller-manager-7f479c786d      1         1        1      31s
As we can see in the above output, the opentelemetry-operator-controller-manager deployment is running in the opentelemetry-operator-system namespace.
OpenTelemetry Collector
The OpenTelemetry facilitates the collection of telemetry data via the OpenTelemetry Collector. Collector offers a vendor-agnostic implementation on how to receive, process, and export the telemetry data.
The collector is made up of the following components:
-
Receivers: It manages how to get data into the collector.
-
Processors: It manages the processing of data.
-
Exporters: Responsible for sending the received data.
We also need to export the telemetry data to the Jaeger instance. Use the following manifest to deploy the collector.
kubectl apply -f - <<EOF
apiVersion: opentelemetry.io/v1alpha1
kind: OpenTelemetryCollector
metadata:
  name: otel
spec:
  config: |
    receivers:
      otlp:
        protocols:
          grpc:
          http:

    processors:

    exporters:
      logging:
      jaeger:
        endpoint: "jaeger-collector.observability.svc.cluster.local:14250"
        tls:
          insecure: true
    service:
      pipelines:
        traces:
          receivers: [otlp]
          processors: []
          exporters: [logging, jaeger]
EOF
In above code Jaeger endpoint is the address of the Jaeger service which is running inside the observability namespace.
We need to deploy this manifest in the same namespace where our application is deployed, so that it can fetch the traces from the application and export them to Jaeger.
To verify the deployment of the collector run the following command.
$ kubectl get deploy otel-collector

NAME              READY    UP-TO-DATE   AVAILABLE      AGE
otel-collector     1/1         1            1          41s
OpenTelemetry auto-instrumentation injection
The above-deployed operator can inject and configure the auto-instrumentation libraries of OpenTelemetry into an application’s codebase as it runs. To enable the auto-instrumentation on our cluster, we need to configure an instrumentation resource with the configuration for the SDK and instrumentation.
Use the below-given manifest to create the auto-instrumentation.
kubectl apply -f - <<EOF
apiVersion: opentelemetry.io/v1alpha1
kind: Instrumentation
metadata:
  name: my-instrumentation
spec:
  exporter:
    endpoint: http://otel-collector:4317
  propagators:
    - tracecontext
    - baggage
    - b3
  sampler:
    type: parentbased_traceidratio
    argument: "0.25"
EOF
In the above manifest, we have used three things: exporter, propagator, and sampler.
-
Exporter: It is used to send data to OpenTelemetry collector at the specified endpoint. In our scenario, it is “http://otel-collector:4317”.
-
Propagators: - It carry traces, context and baggage data between distributed tracing systems. It have three propagation mechanism:-
-
tracecontext: This refers to the W3C Trace Context specification, which defines a standard way to propagate trace context information between services.
-
baggage: This refers to the OpenTelemetry baggage mechanism, which allows for the propagation of arbitrary key-value pairs along with the trace context information.
-
b3: This refers to the B3 header format, which is a popular trace context propagation format used by the Zipkin tracing system.
-
Sampler: - It uses a “parent-based trace ID ratio” strategy with a sample rate of 0.25 (25%). This means that when tracing a request, if any of its parent requests has already been sampled (with a probability of 0.25), then this request will also be sampled, otherwise it will not be traced.
To verify that our custom resource is created or not, we can use the below-mentioned command.
$ kubectl get otelinst

NAME                   AGE          ENDPOINT                          SAMPLER                 SAMPLER ARG
my-instrumentation      6s     http://otel-collector:4317       parentbased_traceidratio          0.25
This means our custom resource is created successfully.
We are using the OpenTelemetry auto-instrumented method, so we don’t need to write instrumentation code in our application. All we need to do is, add an annotation in the pod of our application for auto-instrumentation. Below are the annotations which we need to add to the deployment manifest.
As we are going to demo a Java application, the annotation which we will have to use here is:
instrumentation.opentelemetry.io/inject-java: "true"
Note: The annotation can be added to a namespace as well so that all pods within that namespace will get instrumentation, or by adding the annotation to individual PodSpec objects, available as part of Deployment, Statefulset, and other resources.
Below is an example of how your manifest will look after adding the annotations. In the below example, we are using annotation for a Java application.
apiVersion: apps/v1
kind: Deployment
metadata:
 name: demo-sagar
spec:
 replicas: 1
 selector:
   matchLabels:
     app: demo-sagar
 template:
   metadata:
     labels:
       app: demo-sagar
     annotations:
       instrumentation.opentelemetry.io/inject-java: "true"
       instrumentation.opentelemetry.io/container-names: "spring"
   spec:
     containers:
     - name: spring
       image: sagar27/petclinic-demo
       ports:
       - containerPort: 8080
We have added instrumentation “inject-java” and “container-name” under annotations. If you have multiple container pods, you can add them in the same “container-names” annotation, separated by a comma. For example, “container-name1,container-name-2,container-name-3” etc.
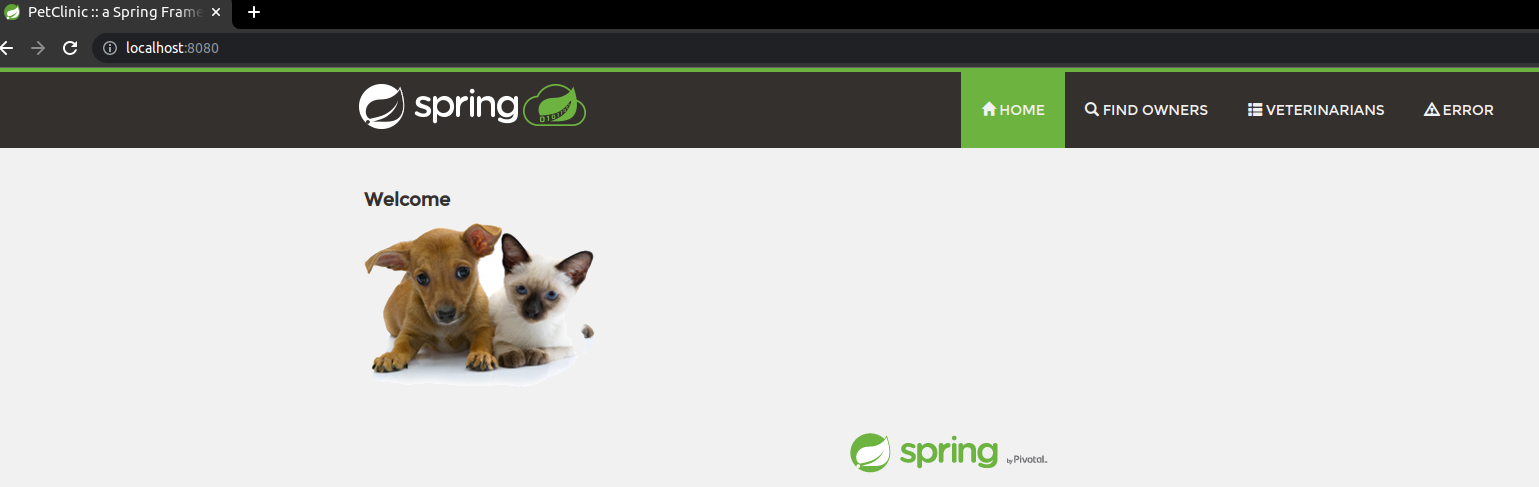
After adding the annotations, deploy your application, and access it on the browser. Here in our scenario, we are using port-forward to access the application.
$ kubectl port-forward service/demo-sagar 8080:8080
To generate traces either you can navigate through all the pages of this website or you can use the following Bash script:
while true;
do
  curl http://localhost:8080/
  curl http://localhost:8080/owners/find
  curl http://localhost:8080/owners?lastName=
  curl http://localhost:8080/vets.html
  curl http://localhost:8080/oups
  curl http://localhost:8080/oups
  sleep 0.01
done
The above-given script will make a curl request to all the pages of the website, and we will see the traces of the request on the Jaeger UI. We are making curl requests to https://localhost:8080 because we use the port-forwarding technique to access the application.
You can make changes in the Bash script according to your scenario.
Now let’s access the Jaeger UI, as our service jaeger-query uses service type LoadBalancer, we can access the Jaeger UI on the browser by using the load balancer domain/IP.
Paste the load balancer domain / IP on the browser and you will see the Jaeger UI there. We have to select our app from the service list and it will show us the traces it generates.
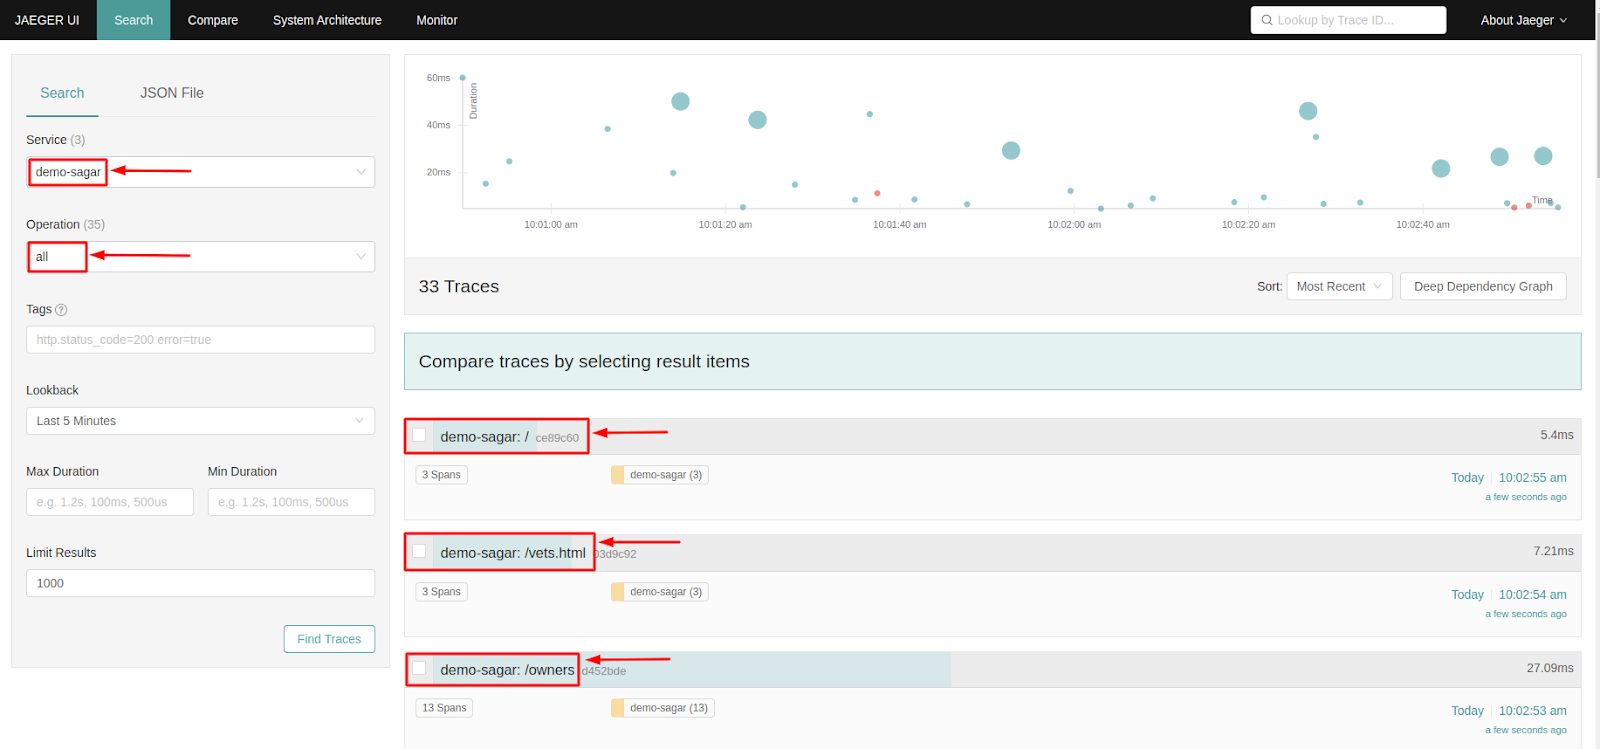
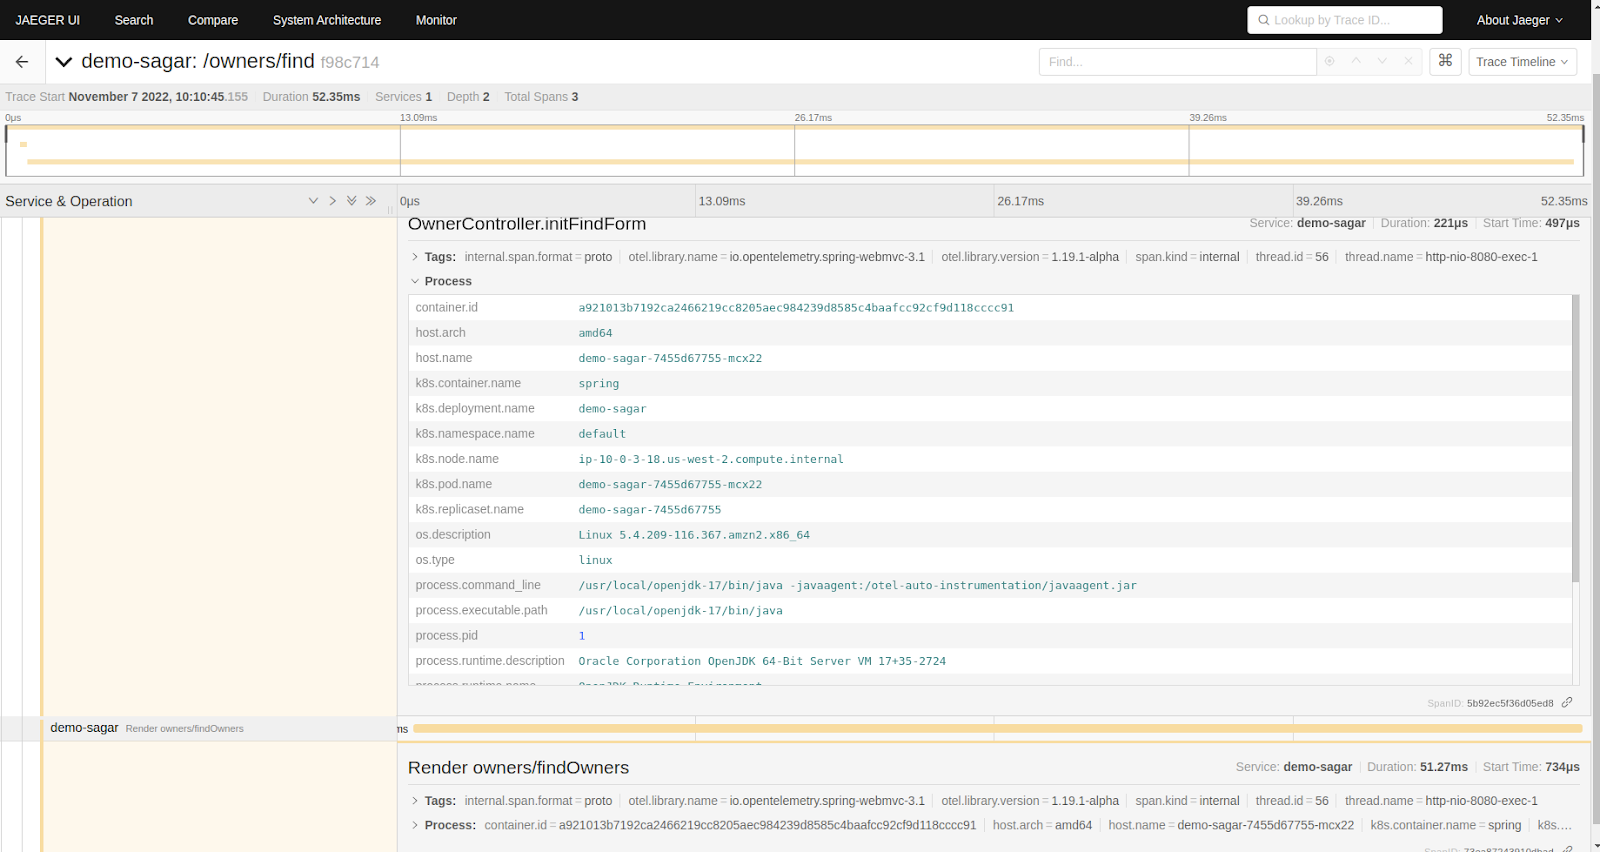
In the above screenshot, we have selected our app name “demo-sagar” under the services option and its traces are visible on Jaeger UI. We can further click on the traces to get more details about it.
Summary
In this blog post, we have gone through how you can easily instrument your application using the OpenTelemetry auto-instrumentation method. We also learned how this telemetric data could be exported to the Elasticsearch backend and visualized it using Jaeger.
Integrating OpenTelemerty with Jaeger will help you in monitoring and troubleshooting. It also helps perform root cause analysis of any bug/issues in your microservice-based distributed systems, performance/latency optimization, service dependency analysis, etc.
We hope you found this post informative and engaging. We would love to hear your thoughts on this post, so do start a conversation on Twitter or LinkedIn :).
If you want to implement observability in your microservices, talk to our observability consulting and implementation experts, and for more posts like this one, do visit our blogs section.
References