Autonomous Log Monitoring and Incident Detection with Zebrium

Why do we Need Autonomous Log Monitoring?
Everything fails, all the time – Werner Vogels, Amazon
As the Amazon CTO once quoted, systems even if they are thoughtfully designed with the utmost care and skills, may fail. Thus, it is important to detect failures using automation to reduce the burden on DevOps and SREs. Developers use extensive prebuilt libraries and products to go to market as fast as they can due to the high-velocity development lifecycle. It is the onus on the SREs to keep the service alive and keeping the MTTR (Mean time to recover) to a minimum. This leads to a problem when the system becomes a black box for SRE and they have to put observability on top of it. Without knowing the internals and without having complete control over the logging information and metrics, they may run blindfolded sometimes until they learn more about the system, new issues, and until they improvise their playbooks or write a solution to prevent failures from happening in the future. That’s the human way of solving problems — learning by mistakes.
It is quite a common scenario in a large distributed system when there is an incident, the teams spend a lot of time to capture the right logs, parse it and try to correlate to find the root cause. Some teams are better, they automate log collection, aggregates them to a common platform, and then do all the hard work by searching into the ocean of log data using tools like Elastic or Splunk. It works fine when you understand the log structure and all the components and know what to look for. But as I mentioned above, it is really hard to keep the data structure consistent for a long time across all components. Most of the current log monitoring and collection tools just provide the capability to collect logs to a central place, parse the unstructured data, allow you to search or filter, and show visualization or trends. What if the system generates a new type of log data or pattern for which you have not automated or planned in advance? It becomes a problem.
That is the point when you really need autonomous machine learning to scale.
Automation is the key to detect such incidents, anomalies in the system — and proactively try to prevent as much as possible to reduce the chances of failure and improve recovery time. — Google SRE Handbook
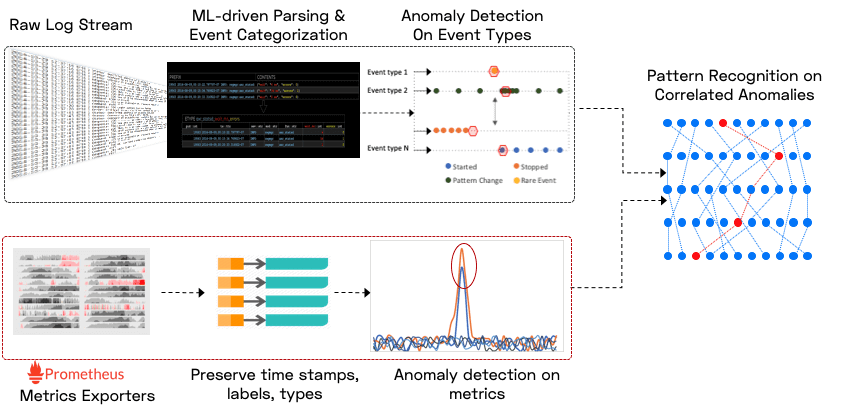
Typically when an incident occurs, support engineers try to manually peek into the ocean of logs and metrics to find interesting errors and warnings and then start correlating various observations to come up with a root cause. This is a painfully slow process where a lot of time is wasted. This is where Zebrium machine learning capabilities helps in automatically correlating issues observed in logs and metrics of various components to predict the root cause.
Introducing Zebrium
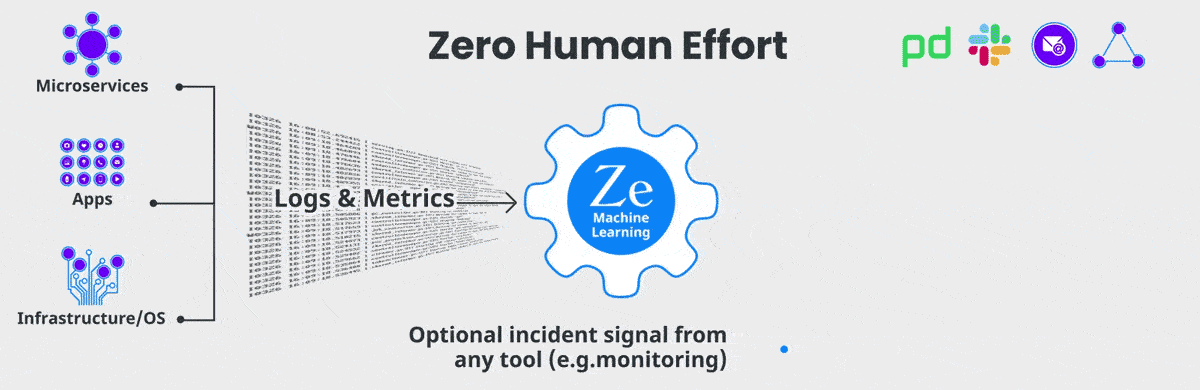
The Zebrium autonomous log and metrics monitoring platform uses machine learning to catch software incidents and show IT and cybersecurity teams the root cause. It is designed to be used with any application, and it is known for its ease of use and quick set-up with customers, who also say the system often delivers initial results within hours of being installed. Unlike traditional monitoring and log management tools that require complex configuration and tuning to detect incidents, Zebrium’s approach to using unsupervised machine learning requires no manual configuration or human training.
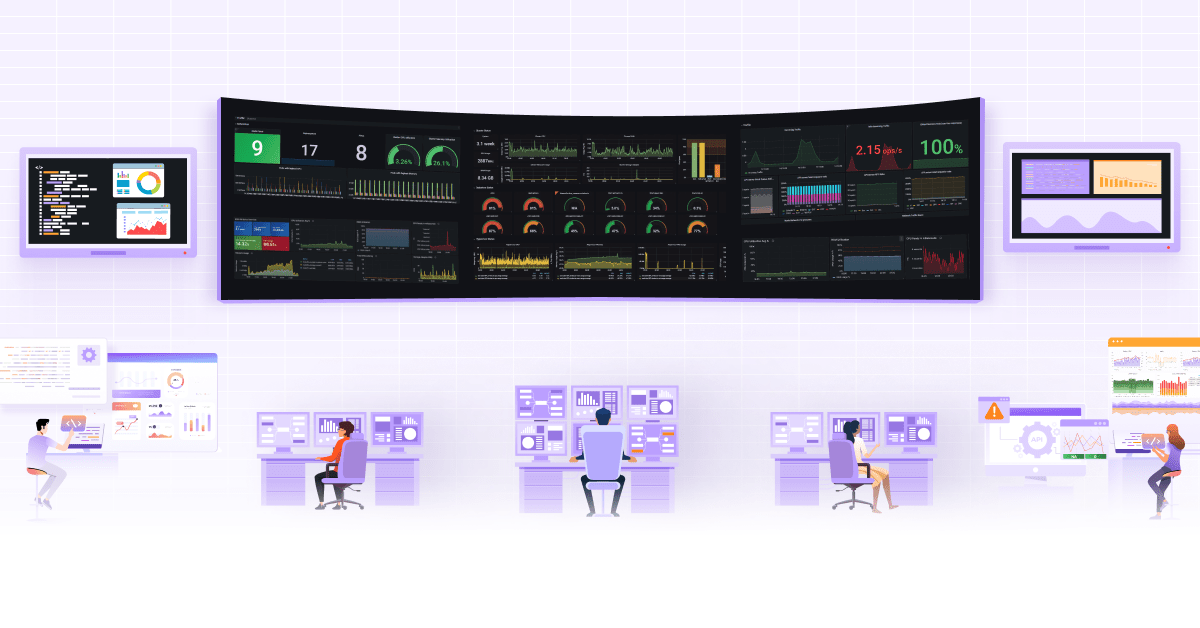
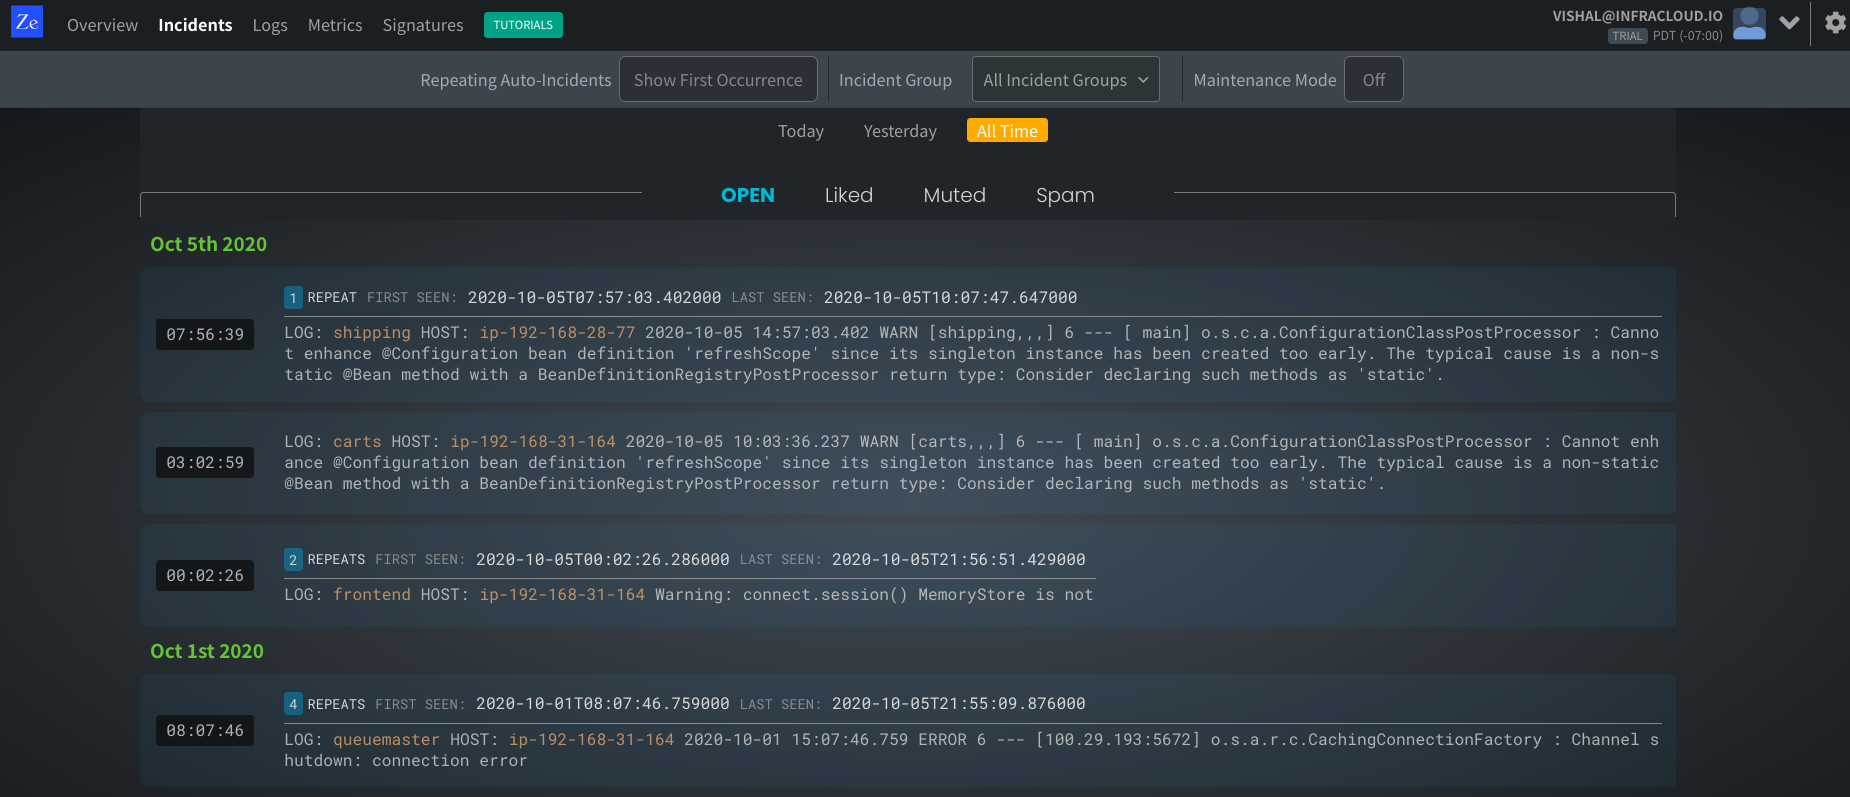
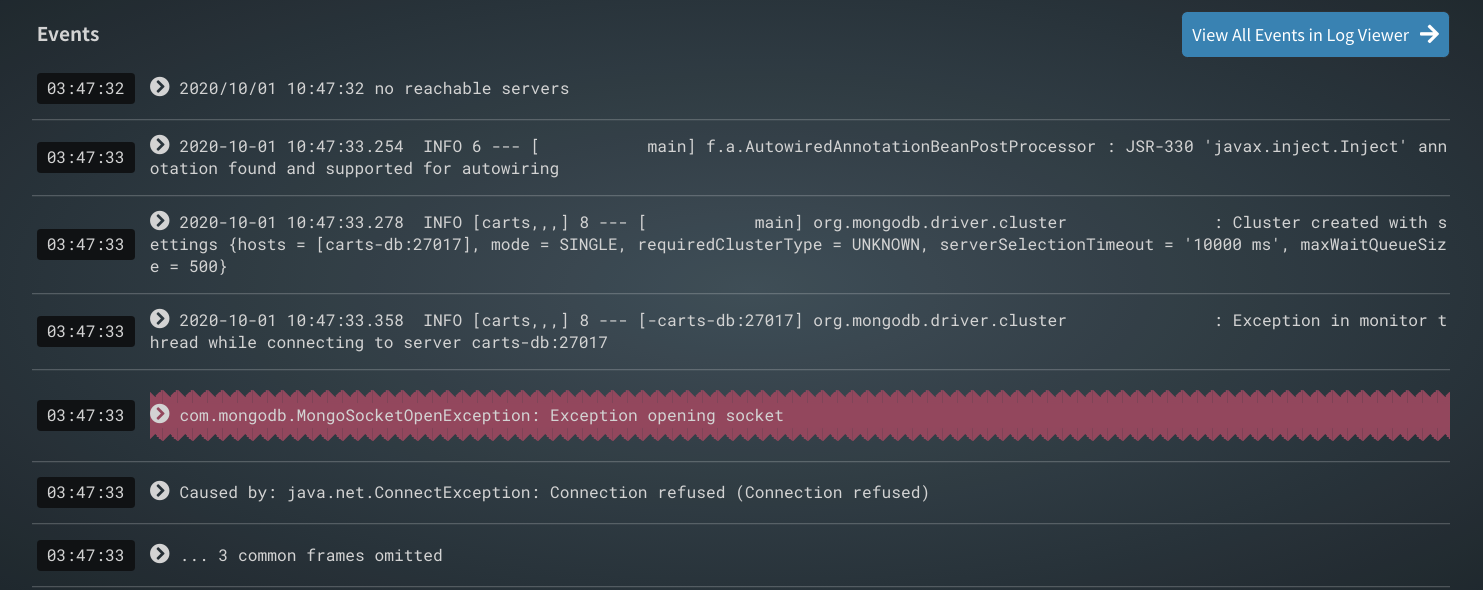
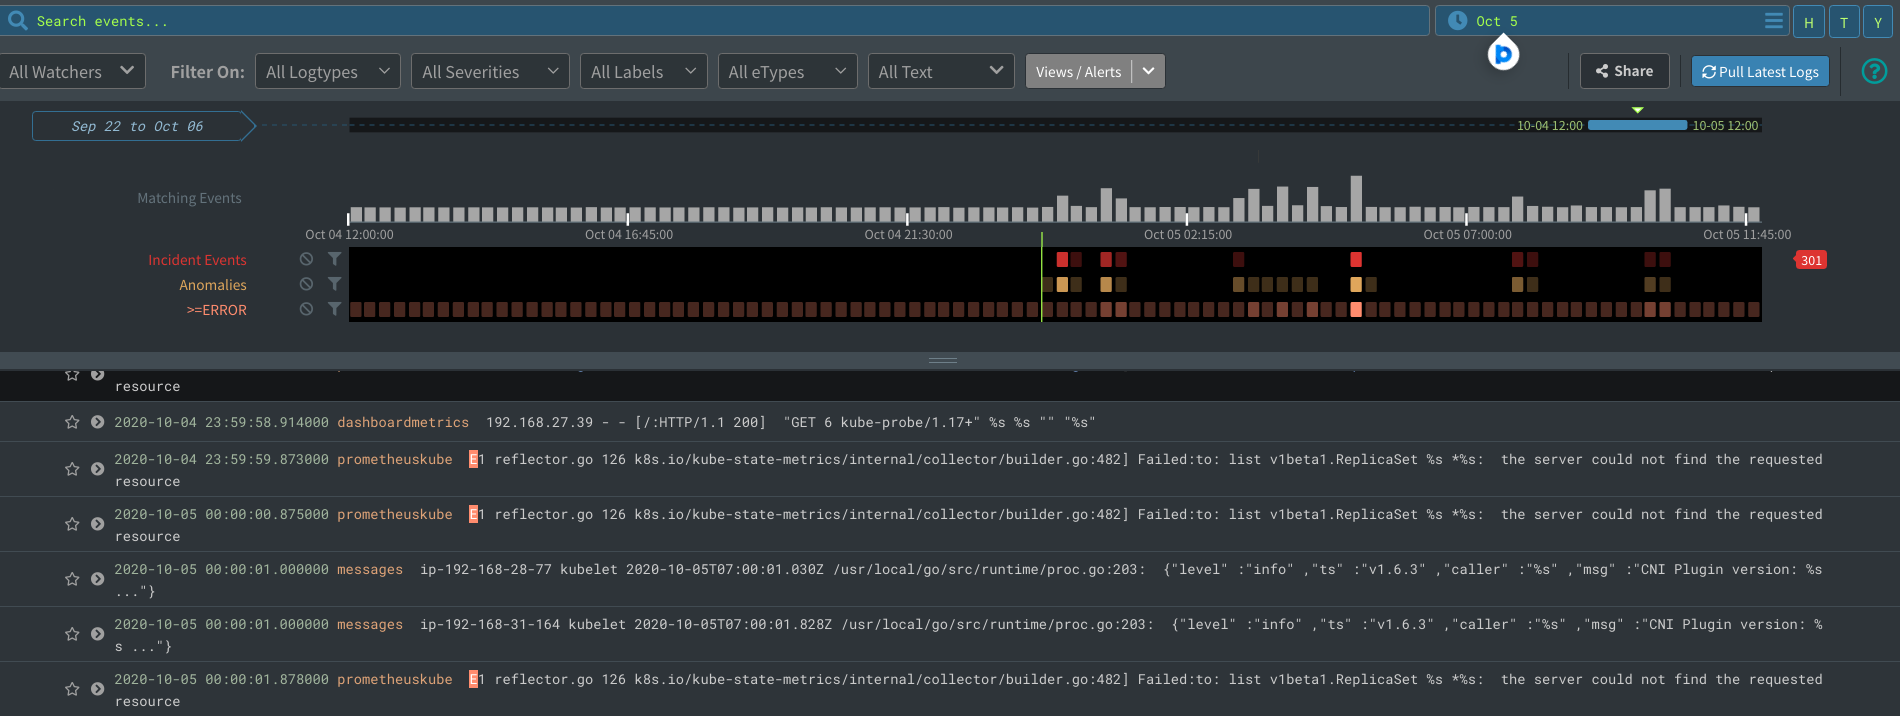
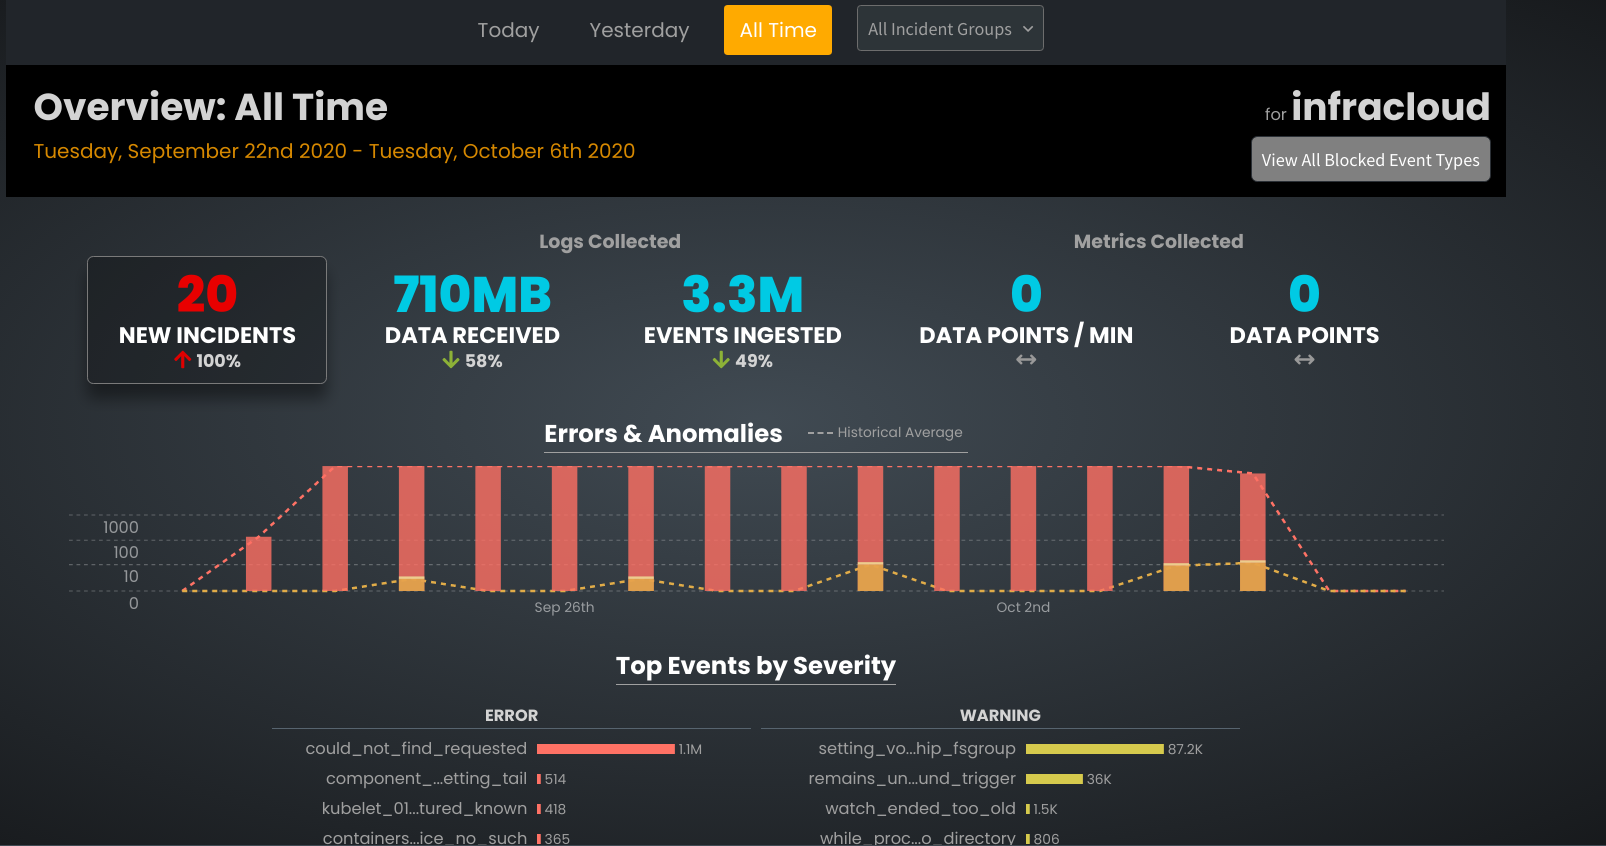 ->Zebrium Dashboard<-
Zebrium aggregates logs and metrics and makes them searchable using filters through easy navigation and drill-down. It also allows us to build alert rules — but most of the time you won’t have to! It uses unsupervised machine learning to autonomously learn the implicit structure of the log messages. It then cleanly organizes the content of each event type into tables with typed columns – perfect for fast and rich queries, reliable alerts, and high-quality pattern learning and anomaly detection. But most importantly, it uses machine learning to automatically catch problems and to show you root cause without you having to manually build any rules.
You can learn more about how Zebrium works here.
Integrations
Zebrium provides various types of log collectors that can pull logs from Kubernetes, Docker, Linux, ECS, Syslog, AWS Cloudwatch, and any type of application.
- ze-cloudwatch Lambda function – This is the typical pattern to pull logs from AWS Cloudwatch to the Zebrium Platform.
- Container/Docker Log Collector: You can refer to this for more information on Log Collector.
- Zebrium Kubernetes log collector – By far the easiest way to stream data from the Kubernetes cluster. It takes less than 2 mins to set up.
- Kubernetes Metrics Collector – Zebrium has created a metrics collector to pull Kubernetes metrics and push to the platform. It requires 4Gi memory for every 100 nodes.
- Zebrium FluentD collector – An easy way to stream logs from a Linux host.
- Log Forwarder – to send the Syslog or any raw log to the platform.
- Zebrium CLI (Ze) – A flexible way to stream log data or upload log files.
Zebrium + ELK (ZELK) Stack — see here

Zebrium provides good integration with existing Elastic Stack (ELK Stack) clusters. You can even view the Zebrium incident dashboard inside Kibana. You can do so by doing the following:
- Configure an additional output plugin in your Logstash instance to send log events and metrics to Zebrium.
- Zebrium’s Autonomous Incident Detection and Root Cause will send incident details back to Logstash via a webhook input plugin.
- Incident summary and drill down into the Incident events in Elasticsearch is available directly from the Zebrium ML-Detected Incidents canvas in Kibana.
- For advanced drill-down and troubleshooting workflows, simply click on the Zebrium link in the Incident canvas.
Third-Party Integrations
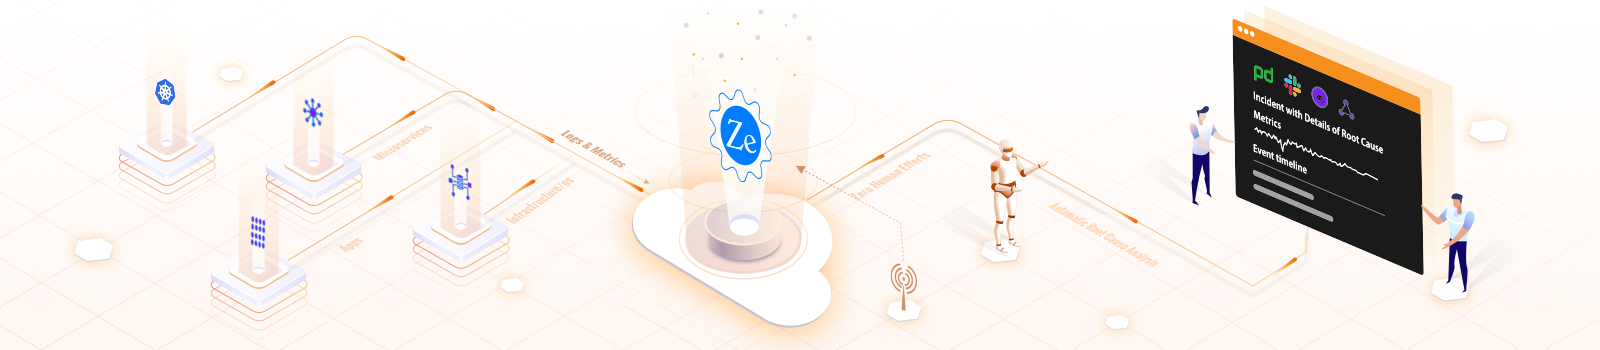
Zebrium’s Autonomous Incident & Root Cause Detection works in two modes:
- It can autonomously detect and create incident alerts by applying machine learning to an incoming stream of logs and metrics. The incident alerts can be consumed via custom webhook, Slack, or email.
- Zebrium can also consume an external signal that indicates an incident that HAS occurred, and in response, it will create an incident report consisting of correlated log and metric anomalies, including likely root cause and symptoms surrounding the incident.
A special class of integrations relates to this second mode, including integrations with OpsGenie, PagerDuty, VictorOps, and Slack. Furthermore, Zebrium integration can be extended to any custom application using webhooks.
Security
- Logical separation and an optional physical separation of data are possible. Each organization’s data is stored in its own schema with proper access control. For those who need further security (physical separation), a dedicated VPC is used.
- Multifactor authentication and encryption. Data at rest is encrypted with AES-256 encryption.
- Handling of sensitive data – Zebrium provides a way to filter out sensitive data/fields. It also provides a way to clinically remove data if uploaded accidentally.
- The system runs in AWS which has PCI DSS, Fedramp, and other leading industry security certifications.
What did I like about Zebrium?
- Quick and easy onboarding with no manual training or rules setup differentiates this product from others.
- Comes with native collectors to consume logs from Kubernetes clusters, Docker, Linux, and AWS Cloudwatch.
- SaaS-based – provides easy access through Web and Webhooks. This could be a problem for a few who want an on-premise setup.
- Integration with Elastic (ELK) is a plus.
- Unsupervised machine learning doesn’t require any input to train initial data.
- Grafana integration is provided to chart Zebrium collected data.
- Easy to understand pricing structure. A $0 plan to try the core features. 🙂
What can be Improved?
- Integration with AWS Cloudwatch is provided but not with various other cloud providers like Google, Azure, etc.
- Integration with incident management systems like ServiceNow etc typically deployed in Enterprises is not documented. It may be possible using the webhooks but I haven’t tried.
Conclusion
Machine intelligence is the key to automate and scale in a large enterprise environment which can reduce operational cost by reducing DevOps/SREs and increase MTTR that can radically transform the business. With the unsupervised learning algorithm used by Zebrium, It becomes easier to find a better correlation between incidents and failures from the log data and metrics without requiring human effort. Zebrium has provided simplified onboarding, that requires no configurational changes in the application or human training, and an easy to navigate UI. It is an appealing next-generation choice in the space of autonomous log and metric management platforms.
Please try their free version to play around with the autonomous machine learning algorithm on your log data and let us know about your thoughts on autonomous log monitoring.
Looking for help with observability stack implementation and consulting? do check out how we’re helping startups & enterprises as an observability consulting services provider.
Stay updated with latest in AI and Cloud Native tech
We hate 😖 spam as much as you do! You're in a safe company.
Only delivering solid AI & cloud native content.
Posts You Might Like