Introducing : Tracing Cassandra with Jaeger

Monitoring and debugging microservices and distributed systems is not trivial. With the rise of containers and ephemeral infrastructure, it is even more critical to have all the data available for the applications. The monitoring as of today is usually done across three axes: metric monitoring, logs, and distributed tracing
Stop reverse engineering applications and start monitoring from the inside.
Metric Monitoring
Standard and application metrics can help in monitoring the application from inside. Metrics include (but not limited to) CPU, memory, disk usage, and custom metrics over time. Metrics help to monitor how the application is performing over a certain time period. You can use SaaS tools like Datadog or set up Prometheus (depending on your requirement & TCO analysis) to collect metrics from all the applications.
Log Monitoring
Application logs are another important source of monitoring. Apart from the standard logs of the systems and errors/exceptions etc. there can be additional logs from the application with various levels of severity/verbosity. These logs act as an important source of monitoring application health and are also used for reporting application health or business specific metrics/analytics.
Distributed Tracing
Tracing gives you the ability to follow a user request from initial interaction like a web user interface to all the way through back end database service. Consider, a particular group of users is facing latency while accessing the service. Then tracing can make it really easy to follow those requests and figure out where the latency is coming. At the scale where you have 100+ microservices in your system, this is definitely going to speed up debugging tasks.
Basically, we can trace each and every execution path a request goes through. Similar to metrics, tracing is also implemented from inside the application. We can have details about individual function calls as well. Client libraries are used to instrument application code. Instrumented applications send tracing information to a back end like Jaeger. These backends provide a way to visualize and store the tracing data called as traces and spans.
Tracing in Cassandra
Apache Cassandra is fault tolerant and highly scalable database system (source. Cassandra has a feature of tracing transactions across nodes. When tracing is enabled, for every transaction detailed information is stored in system_traces keyspace.
Let’s take a look at a SELECT query,
cqlsh> TRACING ON;
Now Tracing is enabled
cqlsh> SELECT * FROM Excelsior.t;

 k | other
---+-------------------
 5 |        get insert
 1 | test test2 Whedon
 8 |        get insert
 0 |       Joss Whedon
 2 |        get insert
 9 |        new insert
 3 |        get insert

(7 rows)

Tracing session: 48c0c190-7099-11e9-b64f-fb0fdefc6af6

 activity                                                                                                                      | timestamp                  | source    | source_elapsed | client
-------------------------------------------------------------------------------------------------------------------------------+----------------------------+-----------+----------------+-----------
                                                                                                            Execute CQL3 query | 2019-05-07 12:55:26.446000 | 127.0.0.1 |              0 | 127.0.0.1
                                                              Parsing SELECT * FROM Excelsior.t; [Native-Transport-Requests-1] | 2019-05-07 12:55:26.516000 | 127.0.0.1 |          71010 | 127.0.0.1
                                                                             Preparing statement [Native-Transport-Requests-1] | 2019-05-07 12:55:26.516000 | 127.0.0.1 |          71293 | 127.0.0.1
                                                                       Computing ranges to query [Native-Transport-Requests-1] | 2019-05-07 12:55:26.516000 | 127.0.0.1 |          71640 | 127.0.0.1
 Submitting range requests on 257 ranges with a concurrency of 167 (0.6 rows per range expected) [Native-Transport-Requests-1] | 2019-05-07 12:55:26.517000 | 127.0.0.1 |          72633 | 127.0.0.1
                                                           Submitted 1 concurrent range requests [Native-Transport-Requests-1] | 2019-05-07 12:55:26.528000 | 127.0.0.1 |          83248 | 127.0.0.1
                 Executing seq scan across 2 sstables for (min(-9223372036854775808), min(-9223372036854775808)] [ReadStage-2] | 2019-05-07 12:55:26.528000 | 127.0.0.1 |          83397 | 127.0.0.1
                                                                          Read 7 live rows and 0 tombstone cells [ReadStage-2] | 2019-05-07 12:55:26.589000 | 127.0.0.1 |         144525 | 127.0.0.1
                                                                                                              Request complete | 2019-05-07 12:55:26.592721 | 127.0.0.1 |         146721 | 127.0.0.1
This information can be really useful to see the time consumed while a particular query or transaction is being processed. Based on it queries can be improved for better performance. For every transaction, a session ID is generated, which can be used to find the saved trace from system_traces. You can find more information about this here.
Plugging in Jaeger in Cassandra
Cassandra provides pluggable tracing starting from version 3.4 (CASSANDRA-10392. To achieve this, we just need to implement two classes and place the jar in the classpath of Cassandra. The Last Pickle has already implemented this and replaced Cassandra’s tracing with Zipkin (cassandra-zipkin-tracing by The Last Pickle). Taking inspiration from their plugin, we started implementing the same functionality using Jaeger as back end.
Let’s take a look at traces of the same query as above
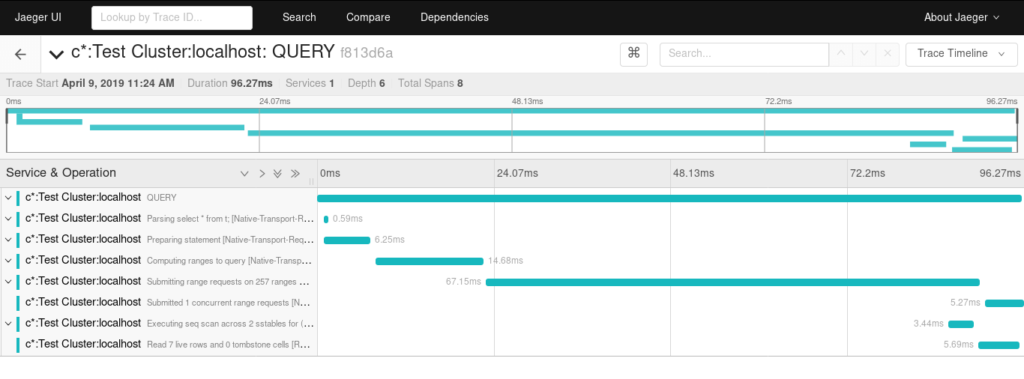 The plugin is in the early stage of development, please try it out and if you face any issues report those on GitHub.
infracloudio/cassandra-jaeger-tracing on GitHub
What’s next
- Implement and test propagation of context over wire protocol (this will help to continue the traces from application to the database)
- Find out a way to fix cqlsh time outs when external tracing mechanism is enabled
Looking for help with observability stack implementation and consulting? do check out how we’re helping startups & enterprises as an observability consulting services provider.
References
Stay updated with latest in AI and Cloud Native tech
We hate 😖 spam as much as you do! You're in a safe company.
Only delivering solid AI & cloud native content.
Posts You Might Like