Linking Traces with Continuous Profiling using Pyroscope

Most cloud based applications today reside as a group of microservices, distributed across different containers and systems. When you have such a large, distributed system, you also need to be prepared for distributed failures as it’s extremely difficult to pinpoint where the error came from. Tools in the Observability stack help you do just that - monitor and alert you when anything goes wrong with your application.
Principles of Observability
One thing we all would agree upon is that issues arise even with the best applications built by the best teams. For instance, Amazon found out that every 100ms latency in their applications costs them 1% of their sales. Hence organizations across the globe rely heavily on observability tools. Before we deep dive into the complex world of observability, it’s important to understand the basic principles of observability.
- Logs are records of events that happened over time. For distributed applications, a log can consist of information about requests and responses, status codes, user ids, etc. It gives good insights into the state of the system when bugs arise. Comes in handy while analyzing the root cause of an outage.
- Traces provide a big picture of how a request progresses through a distributed system. Especially with microservices based architecture, a request may interact with different APIs and databases which all are potential points of failure.
- Metrics provide an overview of a system’s performance and health. They help you track events over time and include things like CPU usage, I/O read/write, latency, etc. They provide a bird’s eye view of your system.
- Profiles provide a detailed view of where your program spends resources, typically CPU cycles or memory. It provides you with an overview of all the most expensive areas of your application down to a single line of code.
Future of Observability — Linking Distributed Tracing with Continuous Profiling
Traditionally, tracing exemplars have been used in linking higher level metrics to more granular traces; in this context, a tracing exemplar is a specific trace which represents a metric (i.e. CPU spike) at a certain point in time.
Now, as the observability space has evolved, tracing provides a higher level view of requests as they traverse through cloud environments which leaves room for profiling exemplars to link higher level traces to more granular profiles. This is achieved by tagging profiles with unique trace metadata that makes it easy to view both complete paths for a request through the trace and also the more granular performance of what code was being executed.
There are a lot of profilers like Parca, Pyroscope, Datadog and Google Cloud profiler to name a few. However, our focus for this post will be Pyroscope, an open source profiling platform, as our observation has shown that configuring OSS provides more efficient TCO than the SaaS services like Datadog for scaling organizations.
It allows the user to collect, store, and query profiling data in a CPU and disk efficient way. Pyroscope focuses on building a storage engine that is built specifically for profiling data to both store and query that data as efficiently as possible. Read more about continuous profiling using Pyroscope.
The future of observability, however, lies in distributed tracing combined with continuous profiling with profiling exemplars. Thanks to OpenTelemetry’s standardization of traces, Pyroscope has introduced a few new packages where, if your application uses OpenTelemetry based traces, you can simply add one of these packages to auto-instrument your code with span-specific profiles:
OTel Pyroscope Packages
The idea behind working on these packages is to integrate tracing with profiling. It’s an implementation of Traceprovider that annotates profiling data with span ids. Whenever a new trace span is generated, the tracer adds a pprof profile_id tag to it. That enables you to filter out a profile of that particular span in Pyroscope.
There are however a few limitations at present:
- Only CPU profiling is available.
- Spans shorter than the sample interval may not be captured. For example, CPU profilers typically probe stack traces 100 times per second, meaning that spans shorter than 10ms may not be captured.
Having described how these packages work in Pyroscope, we can now look into how to link traces to profiles using Jaeger and Pyroscope.
Linking Traces to Profiles using Jaeger & Pyroscope
We will use a sample ride sharing app to demonstrate how Pyroscope can be used in conjunction with tracing. We will instrument that example with OpenTelemetry tracer along with Jaeger.
Note: Tracing integration is supported in Pyroscope starting from v0.14.0. Please ensure to have the latest version of Pyroscope installed. This is also using a fork of Jaeger UI which allows flame graphs to render inside of the Jaeger UI.
The example used here is available in Pyroscope’s Tracing Integration Example repository.
Use Case
The sample rideshare application is developed in such a way that it simulates a real-world scenario. The application replicates a typical ride sharing application where a user can book a car, bike, or scooter. It emulates functions like finding the nearest vehicle and checking driver availability to name a few. There’s a loadgen file that simulates the ride booking processing from various regions.
Traces and span data are embedded at various places in the application. These will be collected by OpenTelemetry and exported to Jaeger. You can view the traces and the span profile using the profile_id generated for a particular span.
Deploying the sample application
Adding Loki Plugin for Docker
Since the example uses Grafana Loki to aggregate the logs, you need to install the Loki plugin for Docker.
docker plugin install grafana/loki-docker-driver:latest --alias loki --grant-all-permissions
You can verify if the plugin is installed correctly or not by checking the status of the plugin using the following command
$ docker plugin ls
ID         	NAME      	DESCRIPTION       	ENABLED
1d4355a20241   loki:latest   Loki Logging Driver   true
Clone the Pyroscope repo and navigate to the jaeger tracing example
git clone https://github.com/pyroscope-io/pyroscope
cd pyroscope/examples/tracing/jaeger
Run the following command to run the application
docker-compose up --build
This will deploy the application with all the necessary prerequisites and execute it.
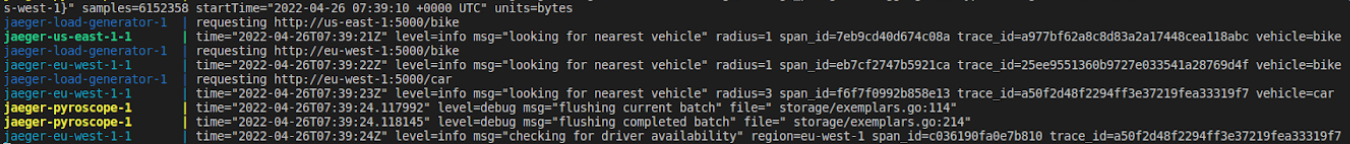
You will see that all the containers are in the running state and our loadgen file is sending requests to the application.
You can navigate to Jaeger UI to view the traces. It can be accessed at http://localhost:4000
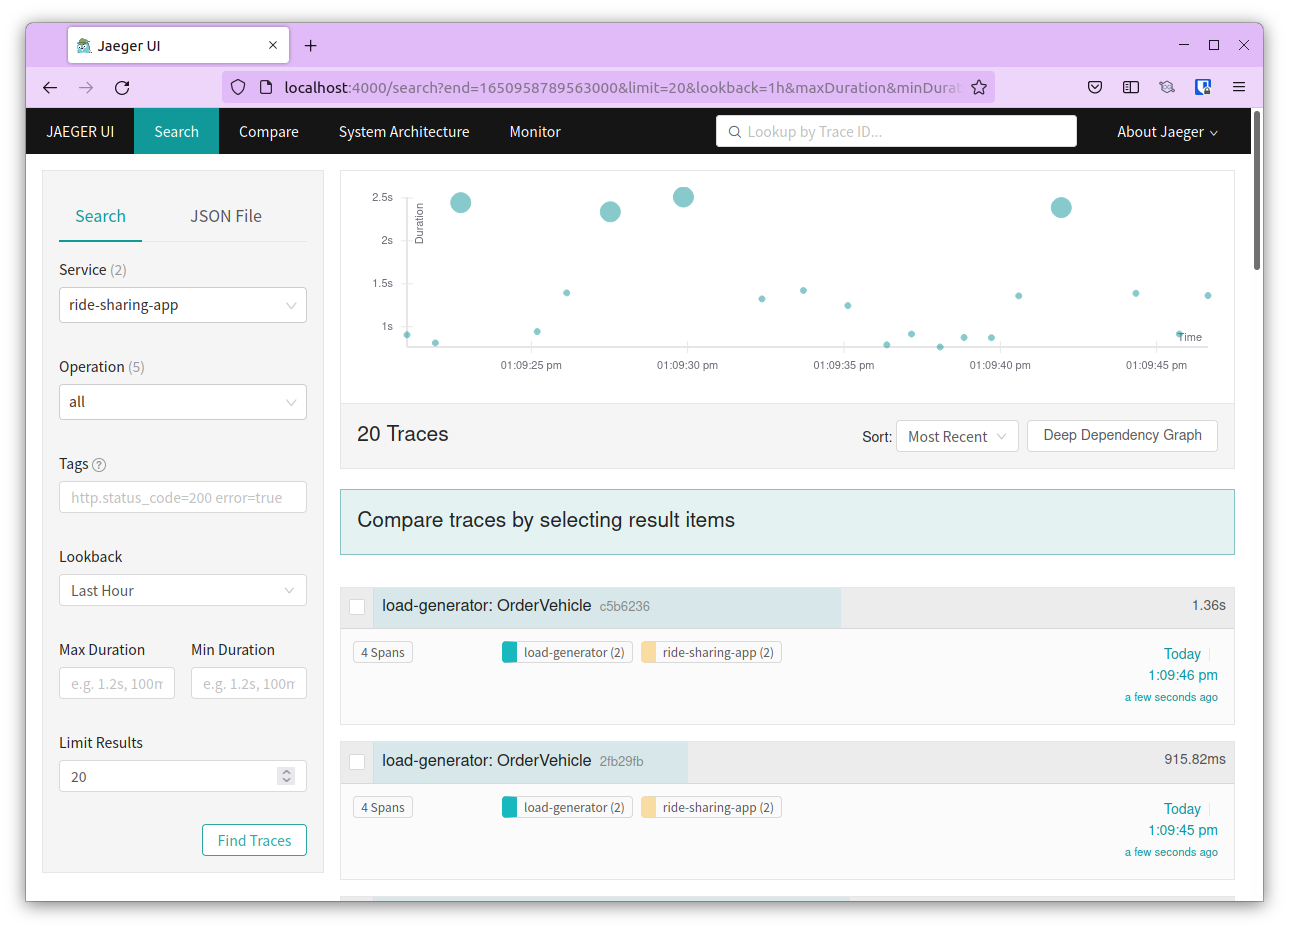
Search for ride-sharing-app under service
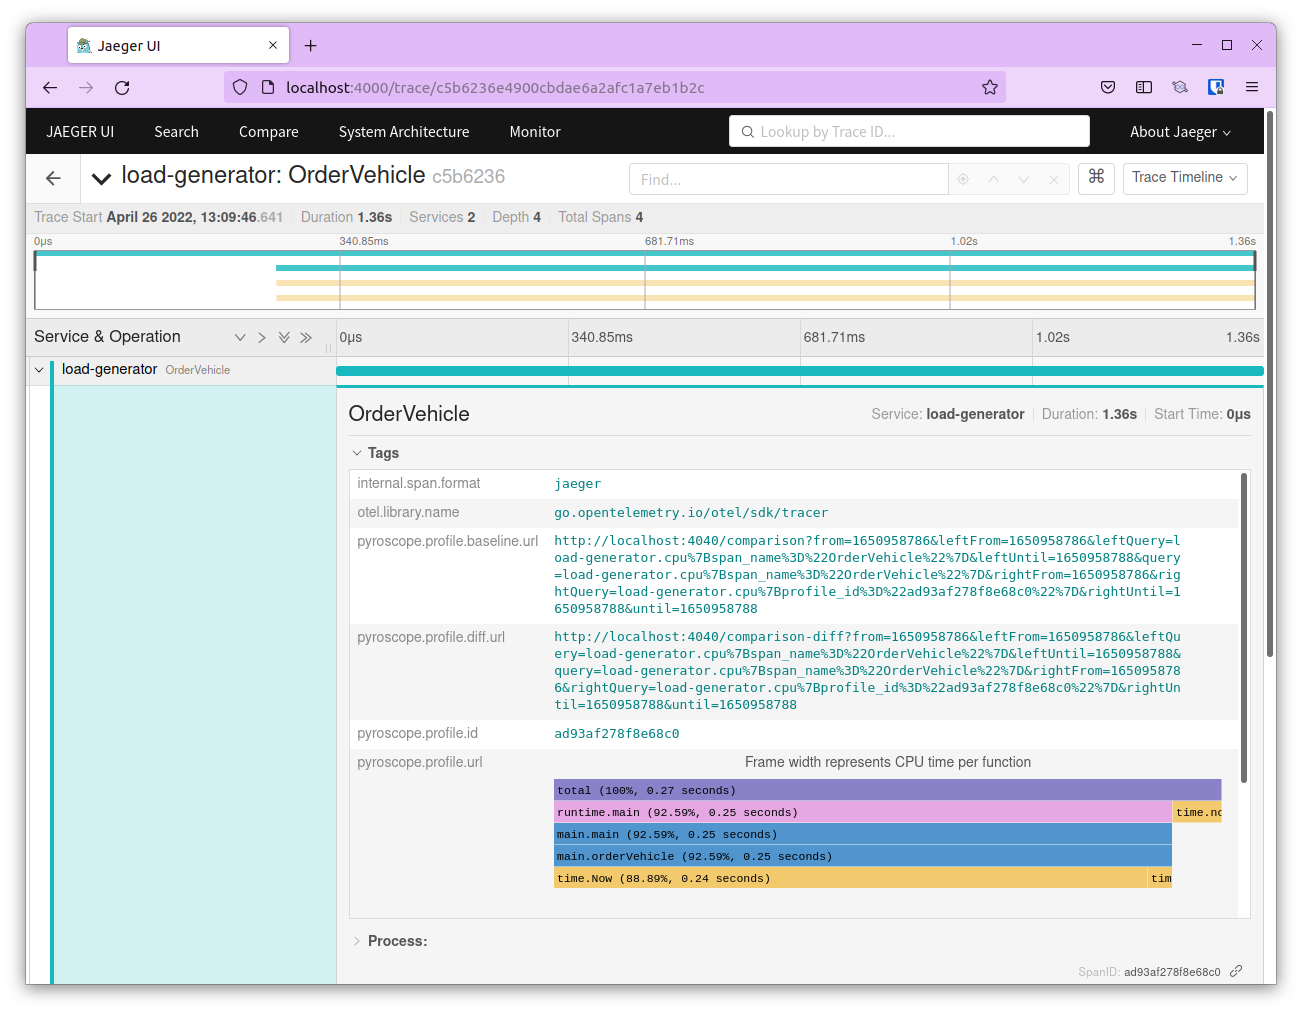
Choose a trace, and select the root - load-generator in this case. Expand Tags and scroll down to pyroscope.profile.id and pyroscope.profile.url You can see the flamegraph for this trace here itself.
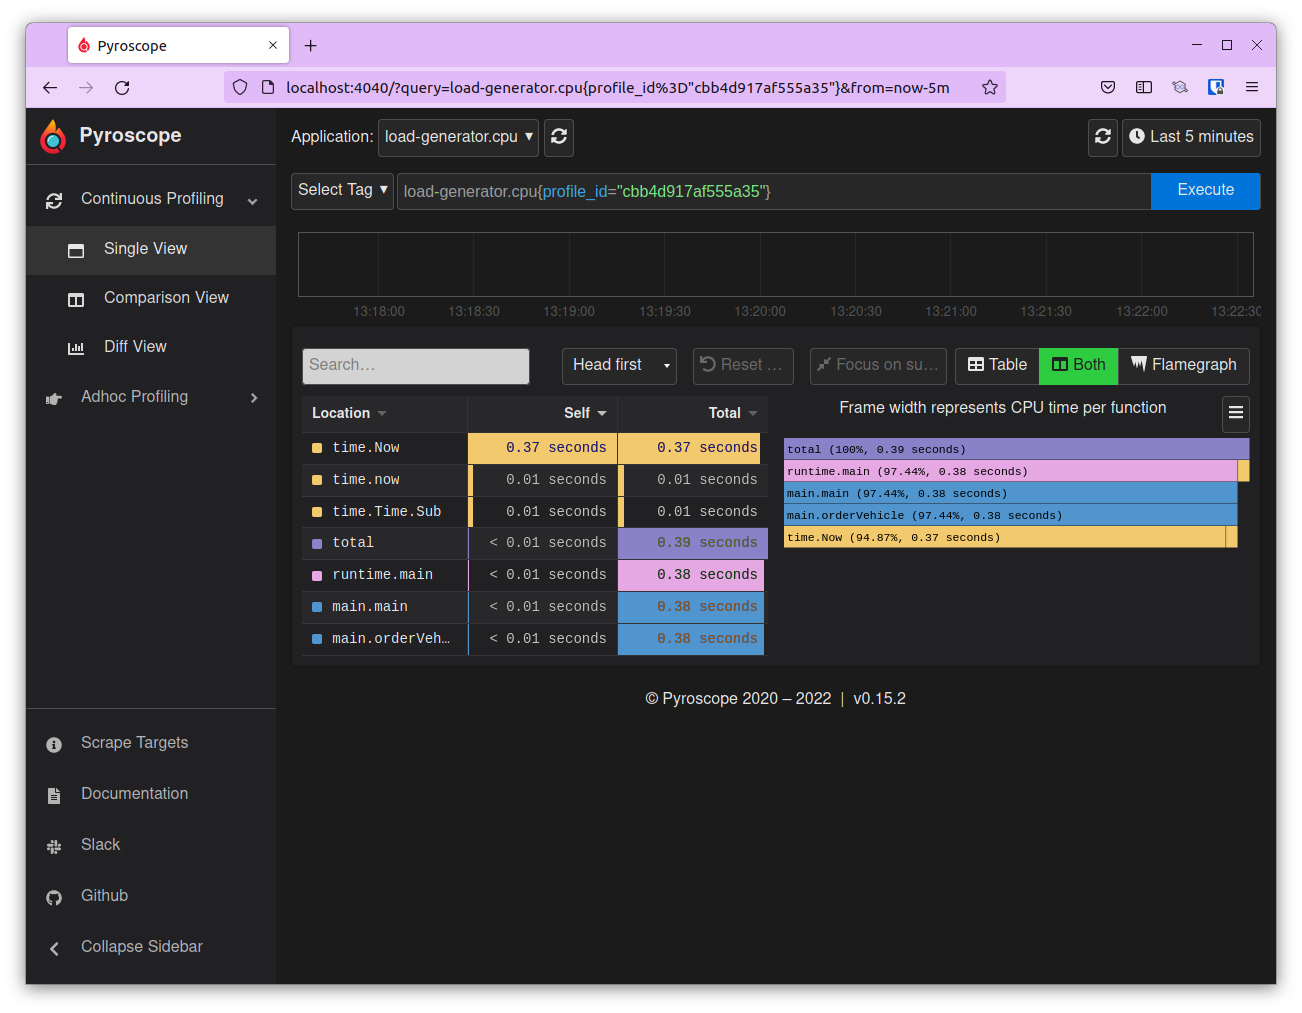
To view it in Pyroscope, copy the profile id. Navigate to the Pyroscope UI at http://localhost:4040 From the Application dropdown choose load-generator.cpu and in the Select Tag field enter profile_id=”<profile-id-copied-from-Jaeger>” and click on Execute to view the flamegraph.
Refer to the image below.
With this, you’ve successfully deployed the application and saw how to link traces to profiles with Pyroscope’s OTel package.
Internal Workings
With this we have successfully deployed and executed the sample ride sharing application. The application showed how Pyroscope’s OTel packages work and links traces to profiles. While it works great on the outside, let us show you how it works under the hood.
Internally, there are two things that are of interest for us:
- Exporter
- OpenTelemetry Configuration
Since the application can be deployed in normal or debug mode, it currently supports two types of exporters.
The default JaegerTraceProvider collects the traces and sends them to Jaeger.
exp, err := jaeger.New(jaeger.WithCollectorEndpoint(jaeger.WithEndpoint(c.JaegerEndpoint)))
While the stdouttrace tracer will pretty print the traces to the console.
exp, err := stdouttrace.New(stdouttrace.WithPrettyPrint())
The trace provider is then configured with OpenTelemetry along with the app name ride-sharing-app. The trace provider is wrapped to annotate with span_id so that pprof can attach profile_id to profiling samples.
With these two in place, every time a trace is needed to be captured, the trace can be created using the following
ctx, span := otel.GetTracerProvider().Tracer("").Start(ctx, "FindNearestVehicle")
span.SetAttributes(attribute.String("vehicle", vehicle))
defer span.End()
The trace is then sent to Jaeger using OpenTelemetry where you can view the traces. Expand a trace to find the profile id and use that to view the span in Pyroscope. You can also view a flamegraph within the Jaeger UI.
Conclusion
That’s all we have to say about using Pyroscope’s OTel Package to integrate tracing with profiling. It brings tracing and profiling together which provides deep insights into how your distributed application is actually performing. If you are already using OpenTelemetry, integrate Pyroscope’s OTEL package to bring profiling to your traces and see exactly how your application is performing.
Check out more sample applications in Pyroscope’s example repo.
I hope you found this post informative and engaging. I’d love to hear your thoughts, let’s start a conversation on Twitter or LinkedIn :)
Stay updated with latest in AI and Cloud Native tech
We hate 😖 spam as much as you do! You're in a safe company.
Only delivering solid AI & cloud native content.
Posts You Might Like