
Audit Logging for MinIO

On a busy Friday, we were doing our business as usual. Suddenly, one of the development team members came to inform us that someone had deleted an important folder from a MinIO bucket. That bucket consists of the folder that doesn’t have versioning enabled, so it cannot be recovered. Using a workaround, we recovered the bucket folders. Despite our efforts, we were unable to determine who deleted the folder.
This incident underscores the importance of audit logs. Audit logs provide detailed information on the operations performed by the application and on the application. MinIO has audit logging capabilities. It provides details on each API operation performed on the MinIO deployment. Had we enabled audit logging beforehand, we could have identified the access key used to delete the bucket, the user agent involved, and the precise time of deletion. Thus, audit logs are invaluable for investigating such events.
In this blog post, we will take a quick look at MinIO and then explore the various ways to enable audit logging in MinIO while covering the optimization strategies for audit logging.
What is MinIO?
MinIO is an open source, lightweight, high-performance object storage solution that can be deployed on cloud and bare-metal servers.
Object storage, also called object-based storage, is a storage method in which data is stored as discrete units called objects. This differs from block storage, which stores data in fixed-sized blocks. You can read more about different types of storage, such as object vs block vs file storage. S3, MinIO, and Oracle Cloud Infrastructure (OCI) Storage are examples of object storage.
Here are several reasons why MinIO is one of the popular open source storage solutions for object storage:
- S3 compatibility: Provides API similar to AWS S3 storage.
- Erasure coding: MinIO utilizes an erasure coding technique to distribute the data and protect the data against a disk or host loss based on the parity code used while creating the tenant.
- Lifecycle management: We can use different Lifecycle Management Policies (ILM policies) for the lifecycle management of MinIO objects such as the expiry of objects after a certain period, tier objects from hot tier to cold tier, etc.
- Encryption: Provides at-rest Server Side Encryption (SSE) and in-transit TLS data encryption to keep data secure during transmission.
- Events and webhooks: Provides notifications for bucket updates. It also provides access logs and audit logging through webhooks for compliance and visibility.
You can read more about MinIO’s features on the MinIO website.
Object storage provides massive scalability. However, as we scale object storage, tracking changes in each operation happening in your object storage becomes critical. That’s why we need to enable audit logging for MinIO.
How to enable audit logging in MinIO?
MinIO supports two targets for audit logging webhooks:
- HTTP target: Used to push audit logs to any HTTP endpoint such as Fluent Bit, etc.
- Kafka target: Used to push audit logs to a Kafka topic.
You can read more about it in MinIO Logging Quickstart Guide.
In this blog post, we are going to enable MinIO audit logging using both of the above approaches.
Enabling MinIO audit logging using the HTTP target approach
In the HTTP target approach, we configure MinIO audit webhook to push logs to an HTTP endpoint. For example, a log search API with Postgres, or push logs to a telemetry agent like Fluent Bit.
In our tutorial, we used Fluent Bit for log collection.
Pre-configurations: Setting up EFK
We are using Elasticsearch, Fluent Bit, and Kibana for logging setup, and they are deployed with Helm charts.
-
First we will create a namespace efk. We will deploy all EFK components in that namespace.:
$ kubectl create ns efk -
Deploy Elasticsearch using below Helm commands:
$ helm repo add elastic https://helm.elastic.co
$ helm repo update
$ helm install elasticsearch  \
        --set service.type=LoadBalancer \
        --set persistence.labels.enabled=true elastic/elasticsearch -n efk
For persistent volume, we use Rook Ceph storage, which is our default storage class.
Note: If you are using a storage class other than the default storage class, you can deploy it by setting
volumeClaimTemplate.storageClassNamevariable. For example, if you are using the gp2 storage class, you can add--set volumeClaimTemplate.storageClassName=gp2to the above command. -
After Elasticsearch is deployed, you can get elastic_username and elastic_password from the below commands:
elastic_username:
$ kubectl get secrets --namespace=efk elasticsearch-master-credentials -ojsonpath='{.data.username}' | base64 -delastic_password:
$ kubectl get secrets --namespace=efk elasticsearch-master-credentials -ojsonpath='{.data.password}' | base64 -d -
Once all elasticssearch pods are running successfully , we can deploy Kibana using:
$ helm install kibana --set service.type=LoadBalancer elastic/kibana -n efk -
For Fluent Bit deployment, add fluent Helm repo:
$ helm repo add fluent https://fluent.github.io/helm-charts -
We are using a custom values file for Fluent Bit config. The overview of the Fluent bit config is as follows:
- We are deploying Fluent Bit as a deployment instead of daemonset because we don’t need to run it on every node, which is generally required if you want to fetch logs from each Kubernetes node.
- We are using an extra port 9880, as our input port for Fluent Bit. MinIO will push logs to Fluent Bit using this port.
- In Fluent Bit config, for the service section, we are using default values of the Helm chart. You can read more about Fluent Bit Service at Fluent Bit Service.
- Then, in the input section, we define 9880 port as our input port, and the tag for input logs will be
minio-audit. You can read more about Fluent Bit inputs at Fluent Bit Inputs. - Then, in filter, we used a record modifier filter to remove unnecessary tags, such as version, time, etc., from MinIO audit logs. You can read more about Fluent Bit filters at Fluent Bit Filters.
- In the output section, we have defined the Elasticsearch endpoint along with its user and password, then we defined tag minio-audit, which will be matched from input logs and then will be pushed to this endpoint. You can read more about Fluent Bit outputs at Fluent Bit Outputs:
Below is the custom YAML file we have created.
Note: you need to update values for elastic_username and elastic_password which we got from step 3.kind: Deployment extraPorts: - port: 9880 containerPort: 9880 protocol: TCP name: tcp config: service: | [SERVICE] Daemon Off Flush {{ .Values.flush }} Log_Level {{ .Values.logLevel }} Parsers_File /fluent-bit/etc/parsers.conf Parsers_File /fluent-bit/etc/conf/custom_parsers.conf HTTP_Server On HTTP_Listen 0.0.0.0 HTTP_Port {{ .Values.metricsPort }} Health_Check On ## https://docs.fluentbit.io/manual/pipeline/inputs inputs: | [INPUT] Name http Listen 0.0.0.0 Port 9880 Tag minio-audit ## https://docs.fluentbit.io/manual/pipeline/filters filters: | [FILTER] Name record_modifier Match minio-audit Remove_key tags Remove_key partition Remove_key remoteHost Remove_key topic Remove_key trigger Remove_key version Remove_key time ## https://docs.fluentbit.io/manual/pipeline/outputs outputs: | [OUTPUT] Name es Match minio-audit Index fluent-bit Host elasticsearch-master.efk.svc.cluster.local Port 9200 HTTP_User <elastic_username> HTTP_Passwd <elastic_password> tls on tls.verify Off Logstash_Format On Logstash_Prefix minio-audit Retry_Limit False Suppress_Type_Name OnAfter creating the values file, deploy Fluent Bit using the following command:
$ helm install fluent-bit fluent/fluent-bit -f fluent-Bit-values.yaml -n efk
Changes to be done on the MinIO side
In our setup, we have deployed MinIO using the operator. You can read more about it at MinIO Operator Installation. The operator is installed using kubectl-minio binary. Then, on top of the operator, we created a MinIO tenant using Operator Console UI. You can refer to steps at Tenant Creation Steps.
To enable the audit webhook, we need to add the below variables in the tenant custom resource YAML spec in the env section and save:
MINIO_AUDIT_WEBHOOK_ENABLE_<webhook_name>: This will enable the audit webhook. If there is any issue, you can just update its value to off to disable the audit webhook.MINIO_AUDIT_WEBHOOK_ENDPOINT_<webhook_name>: An HTTP endpoint where MinIO will push the audit logs.
In our demo setup, we are using the below env values:
env:
- name: MINIO_AUDIT_WEBHOOK_ENABLE_test
  value: "on"
- name: MINIO_AUDIT_WEBHOOK_ENDPOINT_test
  value: http://fluent-bit.efk.svc.cluster.local:9880
Verify audit logging
After you update the tenant custom resource with the above values, tenant pods will restart. Once all pods are restarted, check if all pods are running. You can check the MinIO tenant status using the below command:
mc admin info tenant_alias_name
Check MinIO tenant pods logs if there are any connection timeout errors to check any network connectivity issues to the webhook endpoint.
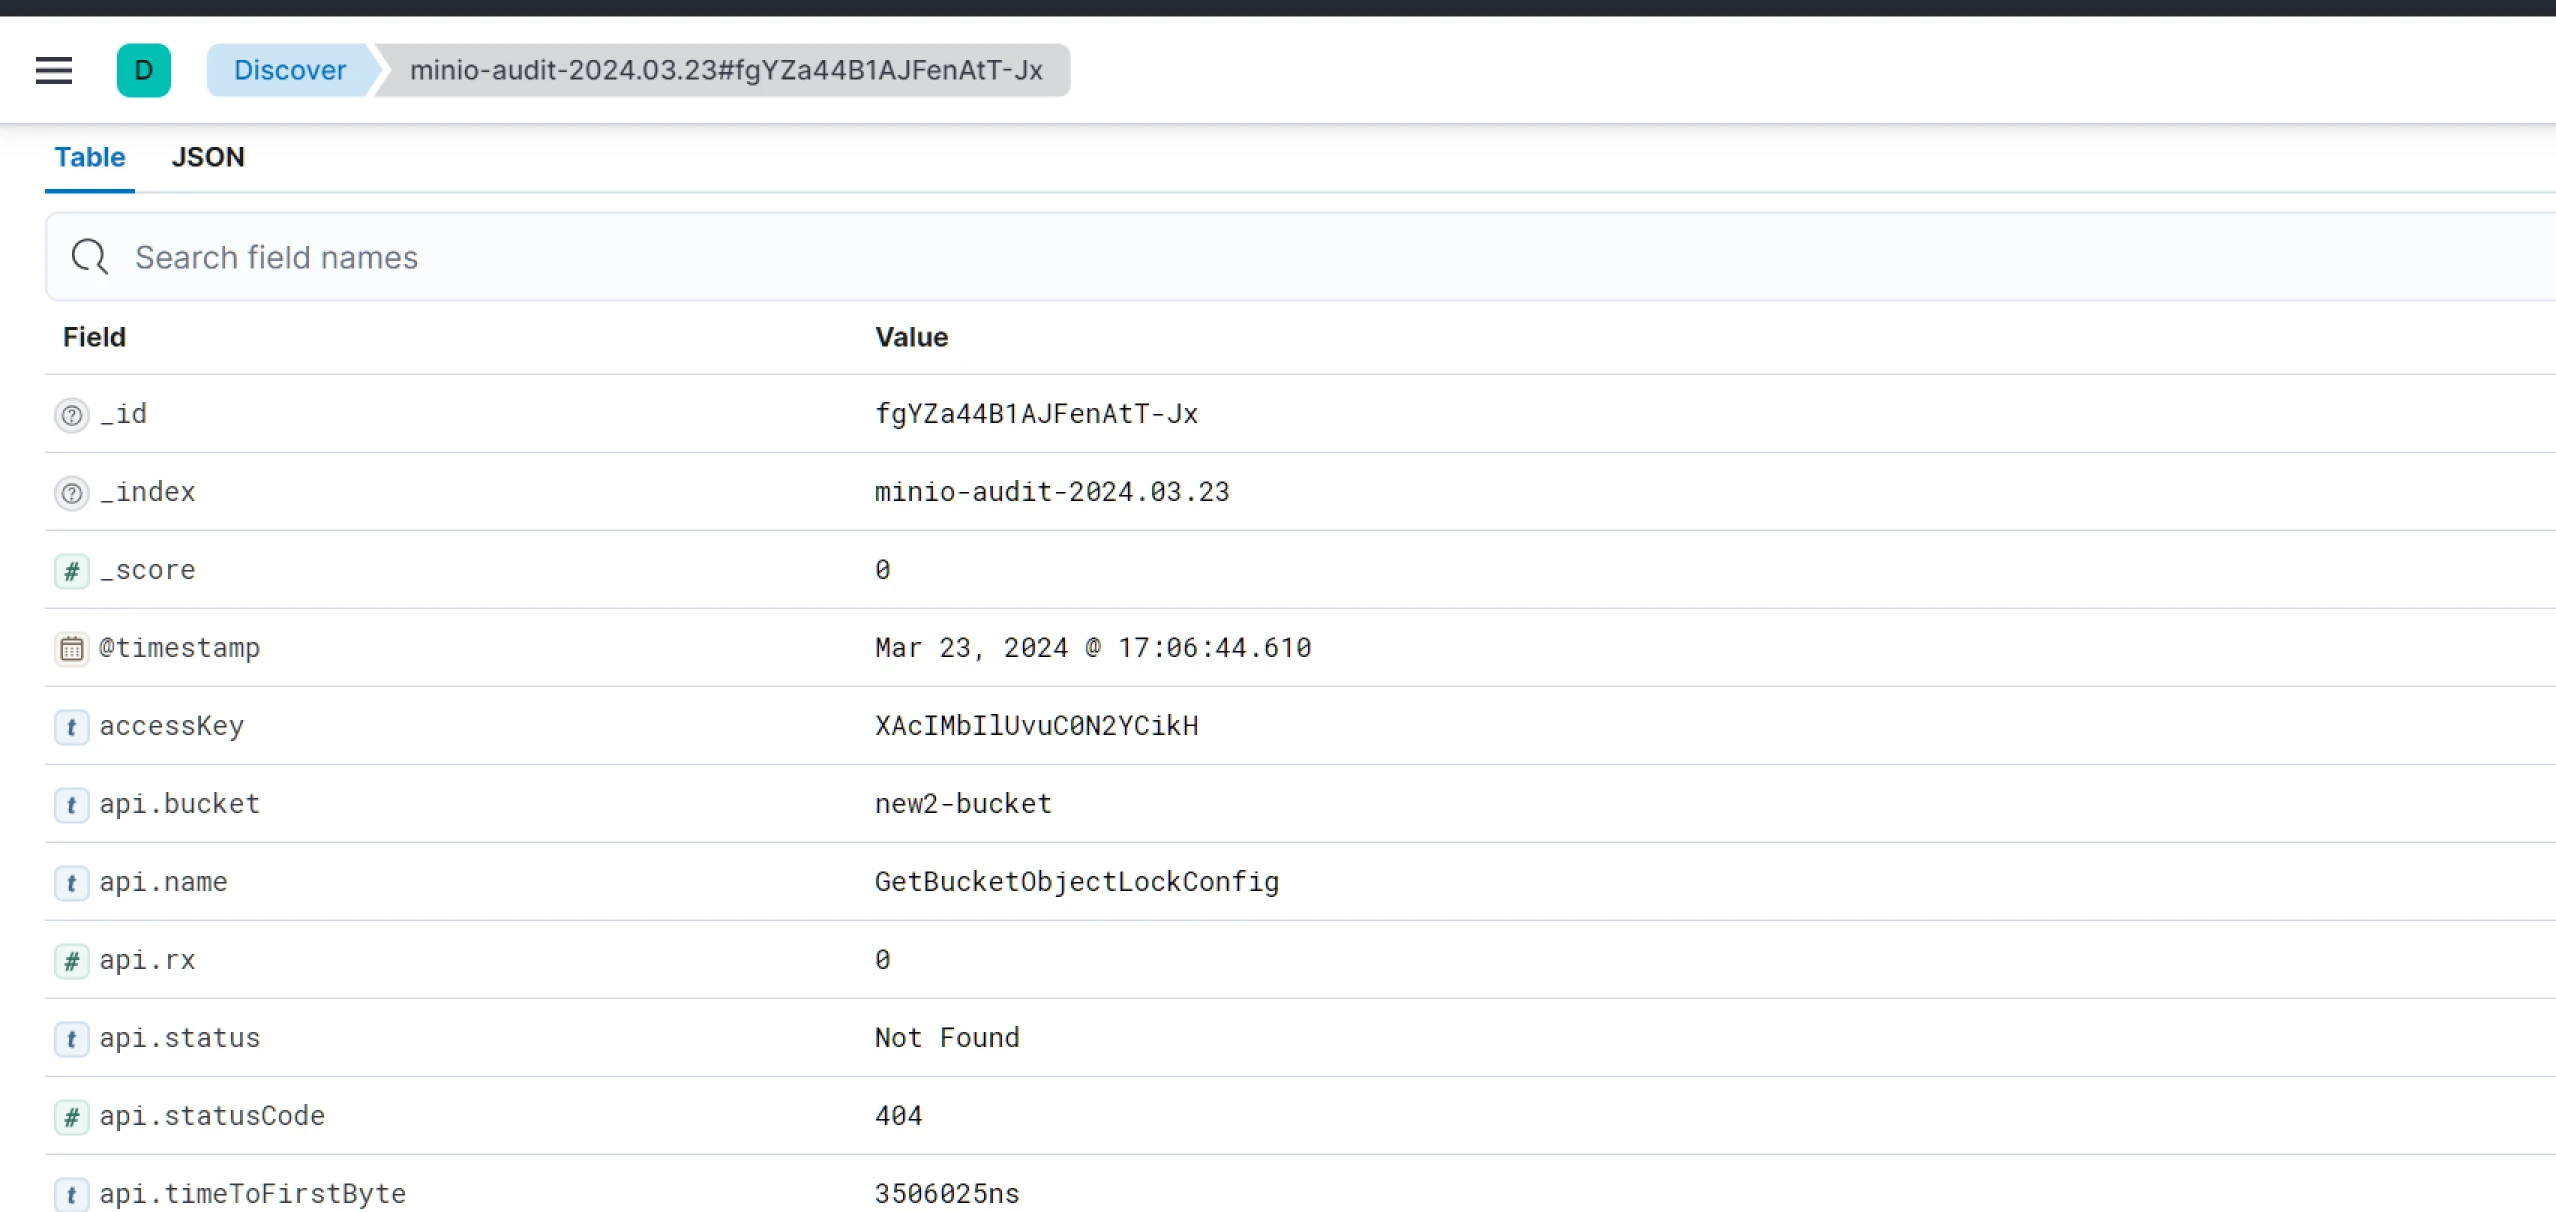
Once verified, log in to Kibana and go to the Discover section. Then, select the index that we set in the Fluent Bit output section in the parameter Logstash_Prefix.
You should be able to see logs similar to below image:
Enabling MinIO audit logging using the Kafka target approach
In Kafka target approach, MinIO audit logs are pushed to a Kafka topic through a webhook.
How is Kafka target approach different from HTTP target approach?
-
With the earlier approach, i.e., HTTP target, we were able to get audit logs from Kibana pushed through Fluent Bit. This works fine in small-scale setups. But in our setup, too many logs were pushed from Fluent Bit to Elasticsearch, i.e., bulk upload. Hence, some records (logs) were getting dropped with Rejected: too many requests exception. This is a synchronous process.
With the Kafka approach, we are making it an async mode. We will push logs into Kafka, and Fluent Bit will subscribe to the Kafka topic, consume that, and push it into Elasticsearch based on the Elasticsearch speed.
Note: We can try retries with the first approach also, but it will congest the network as it is a synchronous process, whereas the second approach is more reliable.
-
If Elasticsearch is down with the HTTP approach, incoming logs will be temporarily stored at Fluent Bit, but after a certain limit, Fluent Bit will delete them. With the Kafka target approach, Kafka will store the logs based on the topic retention period. It will also maintain the consumer_offset for Fluent Bit. It will act as a fallback until Fluent Bit retries.
Pre-configurations: Setting up Kafka and EFK
In this setup, we will be deploying the Strimzi Kafka operator. Once it’s deployed, we will deploy a Kafka cluster with KRaft mode, 3 brokers, and 1 controller nodepool. Then we will be creating a Kafka topic to which MinIO will be pushing audit logs. After that, we will deploy Fluent Bit, which will take audit logs and push them to Elasticsearch for a particular index.
We can check the logs through Kibana using that Elasticsearch index. Now, we will discuss this setup in detail.
Kafka setup
For Kafka deployment, we are using the Strimzi Kafka operator in KRaft Mode. Strimzi Kafka operator simplifies deploying Kafka cluster and related Kafka components. KRaft mode negates the requirement of zookeeper and makes the setup lighter.
Here are the files for Kafka setup.
-
Create a namespace named Kafka using:
$ kubectl create ns kafka -
Go to files for Kafka setup. Then apply strimzi Kafka CRDs:
$ kubectl apply -f crds.yaml -
Then deploy Strimzi Kafka operator using the below command:
$ kubectl apply -f operator.yaml -
Once deployed, check that the operator pod is running and proceed to deploy nodepool with the below command:
$ kubectl apply -f nodepool.yaml -
This will create a custom resource of nodepool for broker and controller but won’t create any pods unless we apply cluster.yaml, which can be done using:
$ kubectl apply -f cluster.yaml -
Once deployed, you should be able to see broker, controller, and entity operator pods as shown below:
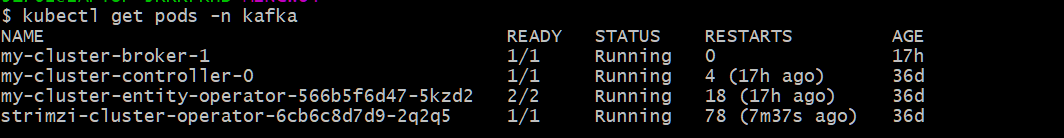
If it’s not in a running state, check the strimzi-cluster-operator pod logs for more details.
-
Once all setup is done, we need a Kafka topic to which audit logs can be pushed. We can create the topic using the below command:
$ kubectl apply -f topic.ymlThis completes our Kafka-related setup, and we can move forward to deploy Elasticsearch, Fluent Bit, and Kibana (EFK) stack.
EFK Setup
To deploy Elasticsearch and Kibana, you can follow the steps discussed in the HTTP Target approach.
For Fluent Bit deployment, add fluent Helm repo:
$ helm repo add fluent https://fluent.github.io/helm-charts
Next, we are using a custom Helm values file for Fluent Bit config. The overview of the Fluent Bit config is as follows:
- We are deploying Fluent Bit as a deployment instead of daemonset as we don’t need to run it on every node, which is generally required if you want to fetch logs from each Kubernetes node.
- In Fluent Bit config, for the service section, we are using default values of the Helm chart.
- Then, in the input section, we are using the Kafka input plugin, which will listen to the Kafka broker on the defined topic where MinIO will push the audit logs.
- We used a record modifier filter in the filters section to remove unnecessary tags from MinIO audit logs.
- Also, we have defined a customer parser named Kafka, which we are using in the filter to parse the input Kafka logs and keep only the payload from it.
- In the outputs section, we have defined the Elasticsearch endpoint along with its user and password. Then, we defined the tag minio-audit, which will be matched from input logs and then pushed to this endpoint.
kind: Deployment

config:
  service: |
    [SERVICE]
        Daemon Off
        Flush {{ .Values.flush }}
        Log_Level {{ .Values.logLevel }}
        Parsers_File /fluent-bit/etc/parsers.conf
        Parsers_File /fluent-bit/etc/conf/custom_parsers.conf
        HTTP_Server On
        HTTP_Listen 0.0.0.0
        HTTP_Port {{ .Values.metricsPort }}
        Health_Check On

  ## https://docs.fluentbit.io/manual/pipeline/inputs
  inputs: |
    [INPUT]
        Name kafka
        Brokers kafka-kafka-brokers.kafka.svc.cluster.local:9092
        Topics my-topic
        Tag minio-audit

  ## https://docs.fluentbit.io/manual/pipeline/filters
  filters: |
    [FILTER]
        Name parser
        Parser kafka
        Match minio-audit
        Key_Name payload
        Reserve_Data On

    [FILTER]
        Name record_modifier
        Match minio-audit
        Remove_key tags
        Remove_key partition
        Remove_key remoteHost
        Remove_key topic
        Remove_key trigger
        Remove_key version
        Remove_key time

  customParsers: |
    [PARSER]
        Name kafka
        Format json
        Time_Key time
        Time Format %Y-%m-%dT%H:%M:%S.%L
        Time_Keep On

  ## https://docs.fluentbit.io/manual/pipeline/outputs
  outputs: |
    [OUTPUT]
        Name es
        Match minio-audit
        Index fluent-bit
        Host elasticsearch-master.efk.svc.cluster.local
        Port 9200
        HTTP_User <elastic_username>
        HTTP_Passwd <elastic_password>
        tls on
        tls.verify Off
        Logstash_Format On
        Logstash_Prefix minio-audit
        Retry_Limit False
        Suppress_Type_Name On
After creating the values file, deploy Fluent Bit using the following command:
$ helm install fluent-bit fluent/fluent-bit -f fluent-bit-values.yaml -n efk
Note: We need Fluent Bit Version 2.2 or later to use Kafka input plugin.
Changes to be done on the MinIO side
To enable the Audit webhook, we need to add the below env variables to the tenant custom resource YAML spec and save it.
MINIO_AUDIT_KAFKA_ENABLE_<webhook_name>: Setting this variable will enable the audit_kafka target. Default is ‘off’. If there are issues, we can set the value to off again to disable the audit_kafka webhook.MINIO_AUDIT_KAFKA_BROKERS_<webhook_name>: List of Kafka broker addresses. If a common Kubernetes service is created, you can define the service DNS endpoint.MINIO_AUDIT_KAFKA_TOPIC_<webhook_name>: Kafka topic where MinIO will push audit logs through the audit_kafka webhook.
In our demo setup, we are using the below values to audit the Kafka target:
env:
- name: MINIO_AUDIT_KAFKA_ENABLE_target1
  value: "on"
- name: MINIO_AUDIT_KAFKA_BROKERS_target1
  value: kafka-kafka-brokers.kafka.svc.cluster.local:9092
- name: MINIO_AUDIT_KAFKA_TOPIC_target1
  value: my-topic
Verification
Please follow the same steps given in the HTTP target approach verification section.
If logs are not appearing in Kibana, check into one of the Kafka broker pods to see if logs are coming. If they are appearing in the Kafka broker, check Fluent Bit pod logs to see if it accepts input from Kafka and pushes to Elasticsearch or if there are any errors while receiving and pushing.
Optimizing and Maintaining audit logs
Remove the unnecessary tags
After enabling audit logs, we could see logs of around 30 GB per day for a tenant. To reduce log volume, we removed some of the tags from the logs which were not required, as shown below:
[FILTER]
    Name record_modifier
    Match minio-audit
    Remove_key tags
    Remove_key partition
    Remove_key remoteHost
    Remove_key topic
    Remove_key trigger
    Remove_key version
    Remove_key time
After applying this filter, we saw almost a 30% reduction in daily log volume. You can assess your requirements and filter out the actions/operations from the logs, which will help you keep the log file size smaller.
Log particular API operations for the audit
A separate MinIO was deployed for one of the products in one of the Kubernetes clusters. We wanted audit logs only for delete operations and all the API operations. We applied the below filter to the Fluent Bit config to do the same:
[FILTER]
    Name grep
    Match minio-audit
    Logical_Op or
    Regex $api[‘name’] ^DeleteMultipleObjects
    Regex $api[‘name’] ^DeleteObject
By applying the above optimization along with the filter given in the first optimization, log volume was further reduced, decreasing the load on the Elasticsearch.
Delete logs after a certain period
To reduce log volume on Elasticsearch, we are retaining MinIO audit logs only for 14 days. For that, we are using Elasticsearch Curator to delete MinIO audit logs indexes that are older than 14 days. You can read this blog to learn how to implement Elasticsearch Curator.
Based on the organization’s compliance policy, this can be tweaked. For example, if the compliance policy requires at least 30 days of logs, then the Elasticsearch curator config needs to be modified to delete indexes older than 30 days.
Conclusion
In continuously scaling systems where multiple people work on the same product, audit logging is a critical part of your object storage solutions to track the changes and updates to your bucket and respective paths.
In this blog post, we have discussed audit logging in MinIO, different ways to implement it, and how the Kafka Approach differs from the HTTP target approach. We have also discussed optimizing audit logs to reduce the overall log volumes and computing load on Elasticsearch.
We hope you found it both informative and engaging. We highly value your feedback and would love to hear your thoughts on this topic. Let’s kickstart a meaningful conversation on LinkedIn to exchange ideas and insights.
Looking for help with observability stack implementation and consulting? Do check out how we’re helping startups & enterprises as an observability consulting services provider.
Stay updated with latest in AI and Cloud Native tech
We hate 😖 spam as much as you do! You're in a safe company.
Only delivering solid AI & cloud native content.
Posts You Might Like