
Achieve Multi-tenancy in Monitoring with Prometheus & Thanos Receiver

This post was originally written by Sayan Das and updated by Akash Warkhade in 2023.
Hey there! If you are reading this blog post, then I guess you are already aware of Prometheus and how it helps us in monitoring distributed systems like Kubernetes. And if you are familiar with Prometheus, then chances are that you have come across the tool called Thanos. Thanos is a popular OSS that helps enterprises achieve a HA Prometheus setup with long-term storage capabilities. One of the common challenges of distributed monitoring is to implement multi-tenancy. Thanos receiver is a Thanos component designed to address this common challenge. Receiver was part of Thanos for a significant duration as an experimental feature. However, after some time, it reached the general availability stage and is now fully supported.
Motivation
We tried this component with one of our clients, it worked well. However, the setup did not turn out to be as smooth as we would have liked it to be. The purpose of this blog post is to lay out a simple guide for those who are looking forward to creating a multi-tenant monitoring setup using Prometheus and Thanos receiver. In this blog post, we will try to use Thanos receiver to achieve a simple multi-tenant monitoring setup where tenant side Prometheus can be a nearly stateless component.
A few words on Thanos Receiver
Receiver is a Thanos component that can accept remote write requests from any Prometheus instance and store the data in its local TSDB, optionally it can upload those TSDB blocks to an object storage like S3 or GCS at regular intervals. Receiver does this by implementing the Prometheus Remote Write API. It builds on top of existing Prometheus TSDB and retains their usefulness while extending their functionality with long-term-storage, horizontal scalability, and down-sampling. It exposes the StoreAPI so that Thanos Queriers can query received metrics in real-time.
Multi-tenancy in Thanos Receiver
Thanos receiver supports multi-tenancy. It accepts Prometheus remote write requests, and writes these into a local instance of Prometheus TSDB. The value of the HTTP header (“THANOS-TENANT”) of the incoming request determines the id of the tenant Prometheus. To prevent data leaking at the database level, each tenant has an individual TSDB instance, meaning a single Thanos receiver may manage multiple TSDB instances. Once the data is successfully committed to the tenant’s TSDB, the requests return successfully. Thanos Receiver also supports multi-tenancy by exposing labels which are similar to Prometheus external labels.
Hashring configuration file
If we want features like load-balancing and data replication, we can run multiple instances of Thanos receiver as a part of a single hashring. The receiver instances within the same hashring become aware of their peers through a hashring configuration file. Following is an example of a hashring configuration file.
[
   {
       "hashring": "tenant-a",
       "endpoints": ["tenant-a-1.metrics.local:19291/api/v1/receive", "tenant-a-2.metrics.local:19291/api/v1/receive"],
       "tenants": ["tenant-a"]
   },
   {
       "hashring": "tenants-b-c",
       "endpoints": ["tenant-b-c-1.metrics.local:19291/api/v1/receive", "tenant-b-c-2.metrics.local:19291/api/v1/receive"],
       "tenants": ["tenant-b", "tenant-c"]
   },
   {
       "hashring": "soft-tenants",
       "endpoints": ["http://soft-tenants-1.metrics.local:19291/api/v1/receive"]
   }
]
- Soft tenancy – If a hashring specifies no explicit tenants, then any tenant is considered a valid match; this allows for a cluster to provide soft-tenancy. Requests whose tenant ID matches no other hashring explicitly, will automatically land in this soft tenancy hashring. All incoming remote write requests which don’t set the tenant header in the HTTP request, fall under soft tenancy and default tenant ID (configurable through the flag –receive.default-tenant-id) is attached to their metrics.
- Hard tenancy – Hard tenants must set the tenant header in every HTTP request for remote write. Hard tenants in the Thanos receiver are configured in a hashring config file. Changes to this configuration must be orchestrated by a configuration management tool. When a remote write request is received by a Thanos receiver, it goes through the list of configured hard tenants. A hard tenant also has the number of associated receiver endpoints belonging to it.
P.S: A remote write request can be initially received by any receiver instance, however, will only be dispatched to receiver endpoints that correspond to that hard tenant.
Architecture
In this blog post, we are trying to implement the following architecture. We will use Thanos v0.31.0 in this blog post.
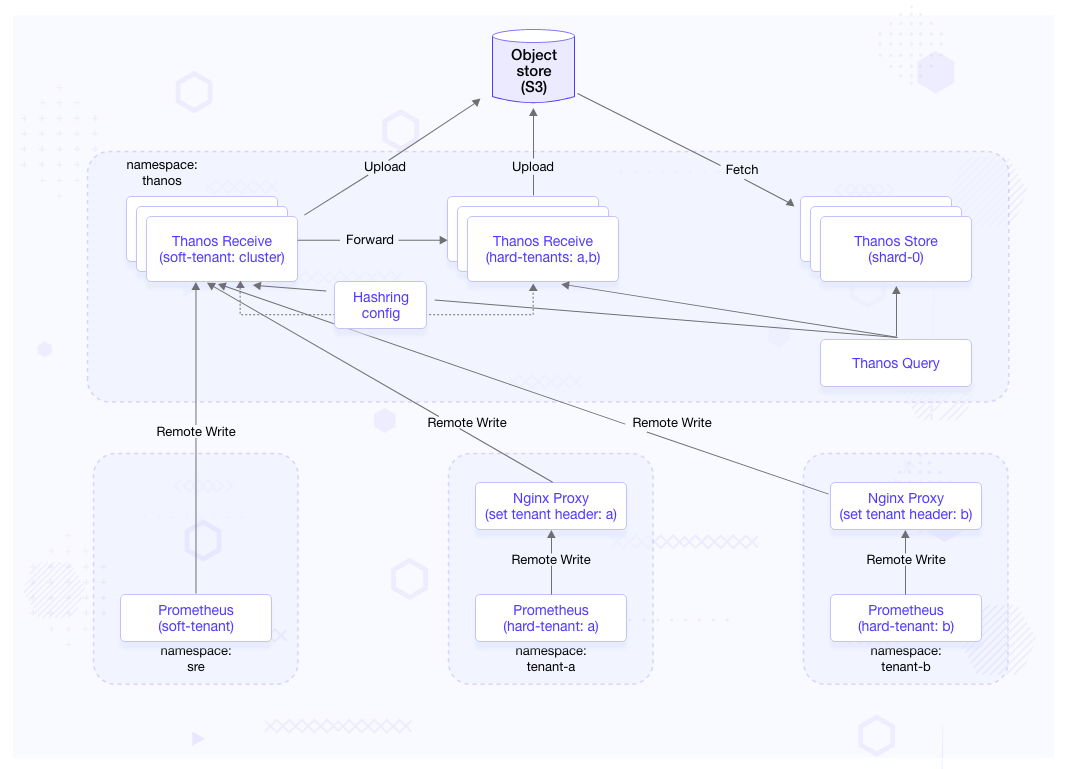
Brief overview on the above architecture:
-
We have 3 Prometheuses running in namespaces:
sre,tenant-aandtenant-brespectively. -
The Prometheus in
srenamespace is demonstrated as a soft-tenant therefore it does not set any additional HTTP headers to the remote write requests. -
The Prometheuses in
tenant-aandtenant-bare demonstrated as hard tenants. The NGINX servers in those respective namespaces are used for setting tenant header for the tenant Prometheus. -
From security point of view we are only exposing the Thanos receiver statefulset responsible for the soft-tenant (sre Prometheus).
-
For both Thanos receiver statefulsets (soft and hard) we are setting a replication factor=2. This would ensure that the incoming data get replicated between two receiver pods.
-
The remote write request which is received by the soft tenant receiver instance is forwarded to the hard tenant thanos receiver. This routing is based on the hashring config.
The above architecture obviously misses few features that one would also expect from a multi-tenant architecture, e.g: tenant isolation, authentication, etc. This blog post only focuses how we can use the Thanos Receiver to store time-series from multiple Prometheus(es) to achieve multi-tenancy. Also the idea behind this setup is to show how we can make the prometheus on the tenant side nearly stateless yet maintain data resiliency.
We will improve this architecture, in the upcoming posts. So, stay tuned.
Prerequisites
- KIND / managed cluster / minikube (We will be using Kind)
kubectlhelmjq(optional)
Cluster setup
Clone the repo:
git clone https://github.com/infracloudio/thanos-receiver-demo.git
Setup a local KIND cluster
- Move to the
local-clusterdirectory:cd local-cluster/ -
Create the cluster with calico, ingress and extra-port mappings:
./create-cluster.sh cluster-1 kind-calico-cluster-1.yaml - Deploy the nginx ingress controller:
helm repo add ingress-nginx https://kubernetes.github.io/ingress-nginx helm repo update helm install nginx-controller ingress-nginx/ingress-nginx -n ingress-nginx --create-namespace - Now, move back to the root directory of the repo:
cd -
Install minio as object storage
helm repo add bitnami https://charts.bitnami.com/bitnami- Install minio in the cluster:
helm upgrade --install my-minio bitnami/minio \ --set ingress.enabled=true --set auth.rootUser=minio --set auth.rootPassword=minio123 \ --namespace minio --create-namespace -
kubectl port-forward svc/my-minio 9001:9001 -n minio - if you face E0528 13:02:43.145873 44832 portforward.go:346] error creating error stream for port 9001 -> 9001: Timeout occurred issue while doing port-forward for minio then execute above port-forward command in one terminal and then open another terminal and execute below command which will keep connection to minio pods keep running.
while true ; do wget 127.0.0.1:9001 ; sleep 10 ; done - then Login to minio by opening http://localhost:9001/ in browser with credentials username minio and password minio123
- Create a bucket with name thanos from UI
Install Thanos components
Create shared components
kubectl create ns thanos

## Create a file _thanos-s3.yaml_ containing the minio object storage config for tenant-a:
cat << EOF > thanos-s3.yaml
type: S3
config:
  bucket: "thanos"
  endpoint: "my-minio.minio.svc.cluster.local:9000"
  access_key: "minio"
  secret_key: "minio123"
  insecure: true
EOF

## Create secret from the file created above to be used with the thanos components e.g store, receiver
kubectl -n thanos create secret generic thanos-objectstorage --from-file=thanos-s3.yaml
kubectl -n thanos label secrets thanos-objectstorage part-of=thanos

## go to manifests directory
cd ../manifests/
Install Thanos Receive Controller
-
Deploy a thanos-receiver-controller to auto-update the hashring configmap when the thanos receiver statefulset scales:
kubectl apply -f thanos-receiver-hashring-configmap-base.yaml
kubectl apply -f thanos-receive-controller.yaml
The deployment above would generate a new configmap
thanos-receive-generatedand keep it updated with a list of endpoints when a statefulset with label:controller.receive.thanos.io/hashring=hashring-0and/orcontroller.receive.thanos.io/hashring=defaultget created or updated. The thanos receiver pods would load thethanos-receive-generatedconfigmaps in them.NOTE: The default and hashring-0 hashrings would be responsible for the soft-tenancy and hard-tenancy respectively.
Install Thanos Receiver
-
Create the thanos-receiver statefulsets and headless services for soft and hard tenants.
We are not using persistent volumes just for this demo.
kubectl apply -f thanos-receive-default.yaml
kubectl apply -f thanos-receive-hashring-0.yaml
The receiver pods are configured to store 15d of data and with replication factor of 2
-
Create a service in front of the thanos receiver statefulset for the soft tenants.
kubectl apply -f thanos-receive-service.yamlThe pods of thanos-receive-default statefulset would load-balance the incoming requests to other receiver pods based on the hashring config maintained by the thanos receiver controller.
Install Thanos Store
Create a thanos store statefulsets.
kubectl apply -f thanos-store-shard-0.yaml
We have configured it such that the thanos querier fans out queries to the store only for data older than 2w. Data earlier than 15d are to be provided by the receiver pods. P.S: There is a overlap of 1d between the two time windows is intentional for data-resiliency.
Install Thanos Querier
Create a thanos querier deployment, expose it through service and ingress.
kubectl apply -f thanos-query.yaml
We configure the thanos query to connect to receiver(s) and store(s) for fanning out queries.
Install Prometheus(es)
Create shared resource
kubectl create ns sre
kubectl create ns tenant-a
kubectl create ns tenant-b
Install kube-prometheus-stack
We install the kube-prometheus-stack
helm repo add prometheus-community https://prometheus-community.github.io/helm-charts
helm upgrade --namespace sre --debug --install cluster-monitor prometheus-community/kube-prometheus-stack \
  --set prometheus.ingress.enabled=true \
  --set prometheus.ingress.hosts[0]="cluster.prometheus.local" \
  --set prometheus.prometheusSpec.remoteWrite[0].url="http://thanos-receive.thanos.svc.cluster.local:19291/api/v1/receive" \
  --set alertmanager.ingress.enabled=true \
  --set alertmanager.ingress.hosts[0]="cluster.alertmanager.local" \
  --set grafana.ingress.enabled=true \
  --set grafana.ingress.hosts[0]="grafana.local"
Install Prometheus and ServiceMonitor for tenant-a
In tenant-a namespace:
-
Deploy a nginx proxy to forward the requests from prometheus to thanos-receive service in thanos namespace. It also sets the tenant header of the outgoing request
kubectl apply -f nginx-proxy-a.yaml -
Create a prometheus and a servicemonitor to monitor itself
kubectl apply -f prometheus-tenant-a.yaml
Install Prometheus and ServiceMonitor for tenant-b
In tenant-b namespace:
-
Deploy a nginx proxy to forward the requests from prometheus to thanos-receive service in thanos namespace. It also sets the tenant header of the outgoing request
kubectl apply -f nginx-proxy-b.yaml -
Create a prometheus and a servicemonitor to monitor itself
kubectl apply -f prometheus-tenant-b.yaml
Test the setup
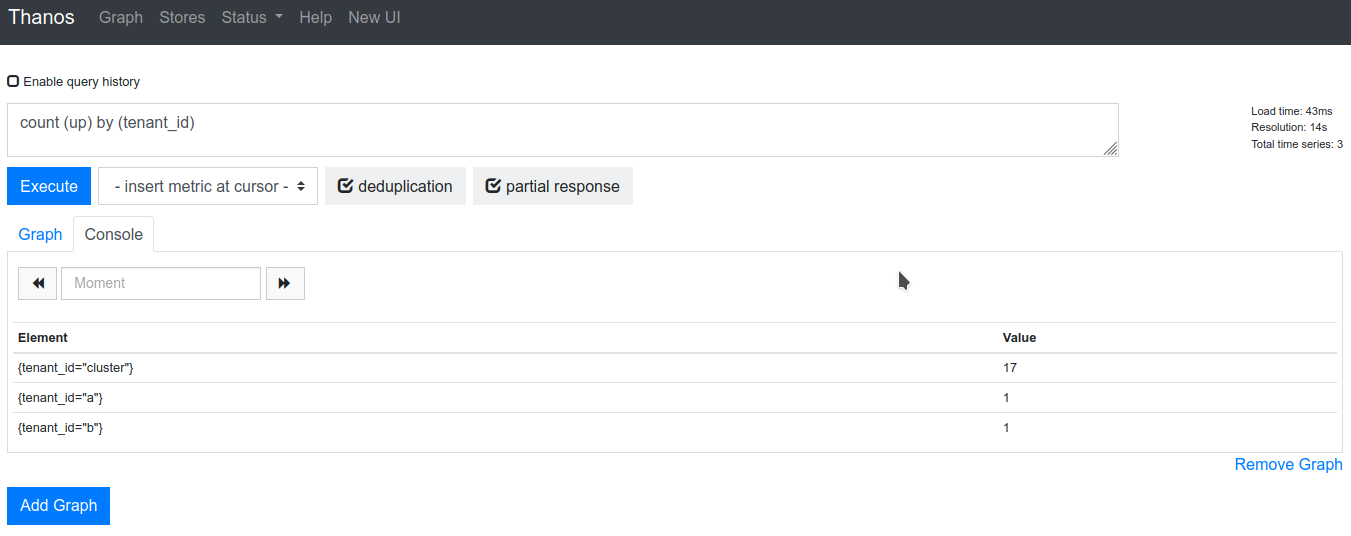
Access the thanos querier by port-forwarding thanos-query service kubectl port-forward svc/thanos-query 9090:9090 -n thanos and open the thanos query UI by opening http://localhost:9090/ in the browser, execute the query count(up) by (tenant_id). We should see a following output:
Otherwise, if we have jq installed, you can run the following command:
curl -s http://localhost:9090/api/v1/query?query="count(up)by("tenant_id")"|jq -r '.data.result[]|"\(.metric) \(.value[1])"'
{"tenant_id":"a"} 1
{"tenant_id":"b"} 1
{"tenant_id":"cluster"} 17
Either of the above outputs show that, cluster, a and b prometheus tenants are respectively having 17, 1 and 1 scrape targets up and running. All these data are getting stored in thanos-receiver in real time by prometheus’ remote write queue. This model creates an opportunity for the tenant side prometheus to be nearly stateless yet maintain data resiliency.
In our next post, we would improve this architecture to enforce tenant isolation on thanos-querier side.
I hope you found this blog informative and engaging. If you encounter any issues while going through this article, you can connect with us and start a conversation on Twitter or LinkedIn.
References
Stay updated with latest in AI and Cloud Native tech
We hate 😖 spam as much as you do! You're in a safe company.
Only delivering solid AI & cloud native content.
Posts You Might Like