Prometheus Definitive Guide Part I - Metrics and Use Cases

Prometheus is an open source metrics-based monitoring system. It has a multi-dimensional data model and has a strong query language to query that data model. This blog post will discuss monitoring in general and Prometheus from a beginner’s point of view.
What is Monitoring?
Monitoring is a process of collecting, analyzing and displaying useful information about a system. Monitoring should primarily cover:
-
Alerting: The primary goal of monitoring is to know when the system fails and generate an alert.
-
Debugging tools or techniques: Another goal for monitoring is collecting the information that helps debug a problem or failure.
-
Generating Trends: The data collected by a monitoring system can be used to generate trends which helps to adapt for the upcoming changes in the system.
Prometheus Architecture
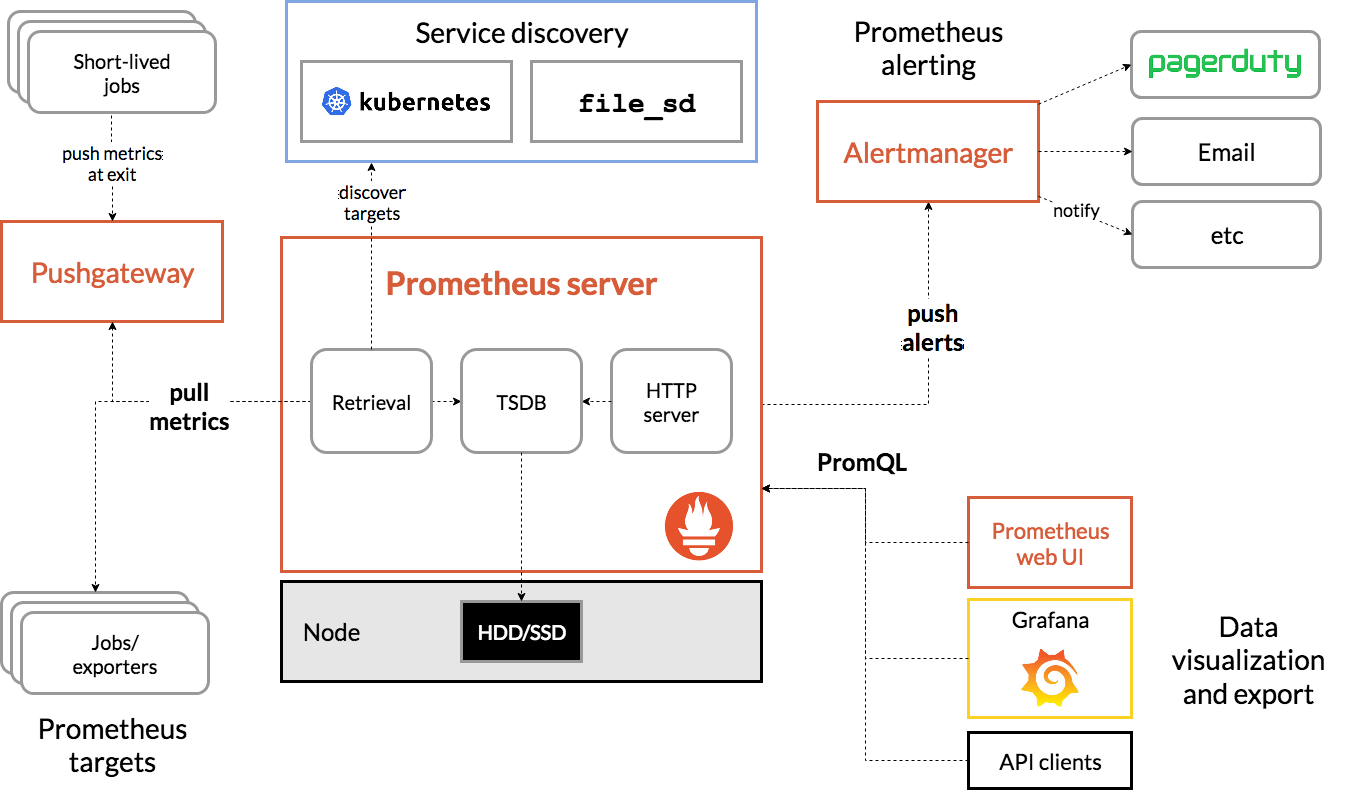
The above figure depicts the detailed Prometheus architecture. It contains one centralized monitoring server (Prometheus). All of the other components like the Alertmanager and Grafana provide extensibility to the main monitoring server. We will divide the architecture into four parts to understand it better.
The first part is the targets that generate the data. The Data can be exposed to Prometheus through client libraries and exporters. Client libraries can help you create & expose metrics from your application code, and exporters are being used when you can’t change the application’s source code. Prometheus uses various exporters to monitor third-party applications like an HTTP server or a database. You could find more details about the exposition format in the Exposition Formats document.
The second part is to find the targets and collect the data. Prometheus uses the service discovery mechanism to detect the targets in an environment. It supports integration with EC2, Consul, Kubernetes, and various other platforms to perform service discovery. The process of collecting the metrics is called scraping the targets.
The third part consists of storage. By default, Prometheus is configured to store data on a local disk. It can also integrate with various types of remote storage solutions for creating a more resilient solution.
The final part comprises alerting and visualization. The alerting rules can be configured in Prometheus, but a separate component called Alertmanager is needed to manage the alerts. For visualization, You can use PromQL to query the metrics and generate graphs in the Prometheus web UI. Along with these graphs, dashboards can be generated using tools like Grafana.
There are two ways in which a monitoring solution can collect the metrics — pull-based and push-based. Pull-based is more popular than the latter nowadays, as it doesn’t require any configurational changes in the entities being monitored. Prometheus server itself uses a pull-based mechanism. A push-based metrics collection can be achieved with a component called Pushgateway. You could find a brief detail about pull-based vs. push-based here.
Prometheus Metrics and Data Model
Prometheus stores all of its data in time series. Each time series consists of a metric, a unique set of labels, and a value for each timestamp. Metrics are the quantitative measurements of a system property. Labels are the key-value pairs associated with these metrics. Labels enable the filtering and aggregation of metrics through PromQL.
Deep diving further, metrics can be classified into four categories. To understand the metrics types better, we will be taking an example of a football match. We will define each metric type and then look at an example for it from our match.
What is Counter?
For recording a value that is always increasing, a counter type metric gets used. For example, the total number of goals scored in a match. We can use a counter type metric to store it as this value doesn’t decrease.
What is Gauge?
For a value that can increment as well as decrement, a gauge metric gets used. For example, possession of a ball in a football match can vary in the range of 0 to 100. It can increase or decrease with time as they play through the game.
What is Histogram?
A histogram counts the frequency of occurrences of some sample values. It also provides information regarding the total values observed and their sum. For example, we can use a histogram to calculate how many players have completed the passes less than 10, 20, 30, 40, 50, 60, etc. Note that the 10, 20, 30, 40, 50, 60 series is pre-defined in a histogram.
| MetricName | Value |
|---|---|
| player_completed_pass_bucket{le=10} | 0 |
| player_completed_pass_bucket{le=20} | 2 |
| player_completed_pass_bucket{le=30} | 7 |
| player_completed_pass_bucket{le=40} | 14 |
| player_completed_pass_bucket{le=50} | 19 |
| player_completed_pass_bucket{le=60} | 22 |
| player_completed_pass_bucket{le=’Inf’} | 22 |
| player_completed_pass_count | 22 |
| player_completed_pass_sum | 790 |
Summary
Summary type is similar to a histogram, as it also counts the frequency over sample values. Additionally, it provides information regarding the total values observed and their sum. Besides this, it adds a label by default to the base metric, i.e., quantile. Quantile tells how many percent values are behind this value. The general quantile which gets assigned to summary ranges from 0 to 1. It is recommended to use summary when you don’t have a pre-defined list of buckets. A detailed comparison of Histogram and summary is given here.
Common Use-cases around Infrastructure Monitoring
So far, we have briefly covered Prometheus and metrics. Before concluding this post, let’s have some hands-on experience as well. We will build some use-case around infrastructure monitoring like CPU/memory usage. We will skip the deployment of Prometheus for this post, but you can use a demo instance available here. One can also deploy their own demo instance using this Git repo.
We can query the data stored in Prometheus using PromQL queries. Queries can be executed through the expression browser in the Prometheus web UI. For this part, we will learn the basics while going through these use-cases.
CPU Usage
The metric which we are going to use is “node_cpu_seconds_total”. This is a counter type metric, and it is used to calculate the seconds for which the CPU is running in a particular mode. CPU has various modes like iowait, idle, user, system, etc. As we are calculating usage, we will drop the idle mode. This is the reason our query looks like this:
sum by (cpu)(node_cpu_seconds_total{mode!="idle"})
We used the sum function to merge all CPU modes. It results in seconds for which the CPU was running since the beginning, but we need to know whether the CPU was busy or idle recently. To do that, we use the rate function, which calculates the growth rate for a counter.
sum by (cpu)(rate(node_cpu_seconds_total{mode!="idle"}[5m]))*100
The above-mentioned query will generate the growth rate for the past five minutes to determine how much computing power is being used by the CPU. As all CPU modes add up to 1, we multiplied our query by a hundred to get the result in a percentage.
Memory Usage
The following query can calculate the total percentage of used memory:
node_memory_Active_bytes/node_memory_MemTotal_bytes*100
This is very straightforward and uses the formula of “used divided by total and multiplied by 100”.
Free Disk
Free disk usage is required to know when you need more space on your infrastructure nodes. Again, we will use the same memory usage approach, but the metric names will get changed.
node_filesystem_avail_bytes / node_filesystem_size_bytes *100
Conclusion
In this blog post, we discussed Prometheus and metrics. We looked at its architecture and ran some queries to get us started. In the next post of this Prometheus definitive guide series, we covered PromQL query language in detail. Hope you found this article helpful for getting started with Prometheus. Do ask your queries and share your experience via Twitter.
Looking for help with observability stack implementation and consulting? do check out how we’re helping startups & enterprises as an observability consulting services provider.
References
- The official Prometheus documentation
- Brazil B.(2018) Prometheus: Up & Running. O’Reilly
- The official Prometheus blog
- Robust Perception demo installation
- InfraCloud’s Prometheus consulting and 3rd party support capabilities
Stay updated with latest in AI and Cloud Native tech
We hate 😖 spam as much as you do! You're in a safe company.
Only delivering solid AI & cloud native content.
Posts You Might Like