Prometheus vs CloudWatch for Cloud Native Applications (Updated in 2024)
 Ruturaj Kadikar
  Hrishikesh Deodhar
 This post (originally published in 2019) has been updated to include recent product updates and cost calculations.
Many companies are moving to Kubernetes as the platform of choice for running software workloads. When an organization using VMs in AWS earlier decides to move to Kubernetes (Either EKS or self-managed in AWS), one of the questions that come up is whether one should continue to use Amazon CloudWatch or switch to some other tool like Prometheus? Many organizations think managing Prometheus can be challenging and bring more overheads. Recently, AWS launched a managed Prometheus service for such organizations. While CloudWatch vs Prometheus is not an exact apple to apple comparison, there are reasons to explore this and choose tooling that is built for the future. This post will explore various aspects and pros and cons, including costs of all three options.
Why compare Prometheus and CloudWatch?
Prometheus and Amazon CloudWatch are very different in the problem they solve, and a 1-1 comparison may seem unfair, but as you start moving to cloud-native stack, Prometheus starts popping up in conversations and for many right reasons. Before we start comparing the two technologies, let’s do a quick high-level overview of both.
AWS CloudWatch overview
AWS CloudWatch is a native service within the suite of AWS services. It helps collect metrics, logs, and events, enabling users to visualize data through customizable dashboards, set alarms for operational thresholds, and respond to system-wide performance changes. In very simplistic terms, CloudWatch acts as a metrics sink for AWS services to publish metrics . These metrics are then used to configure alarms and statistics. The services which publish metrics to CloudWatch are listed in the documentation here.
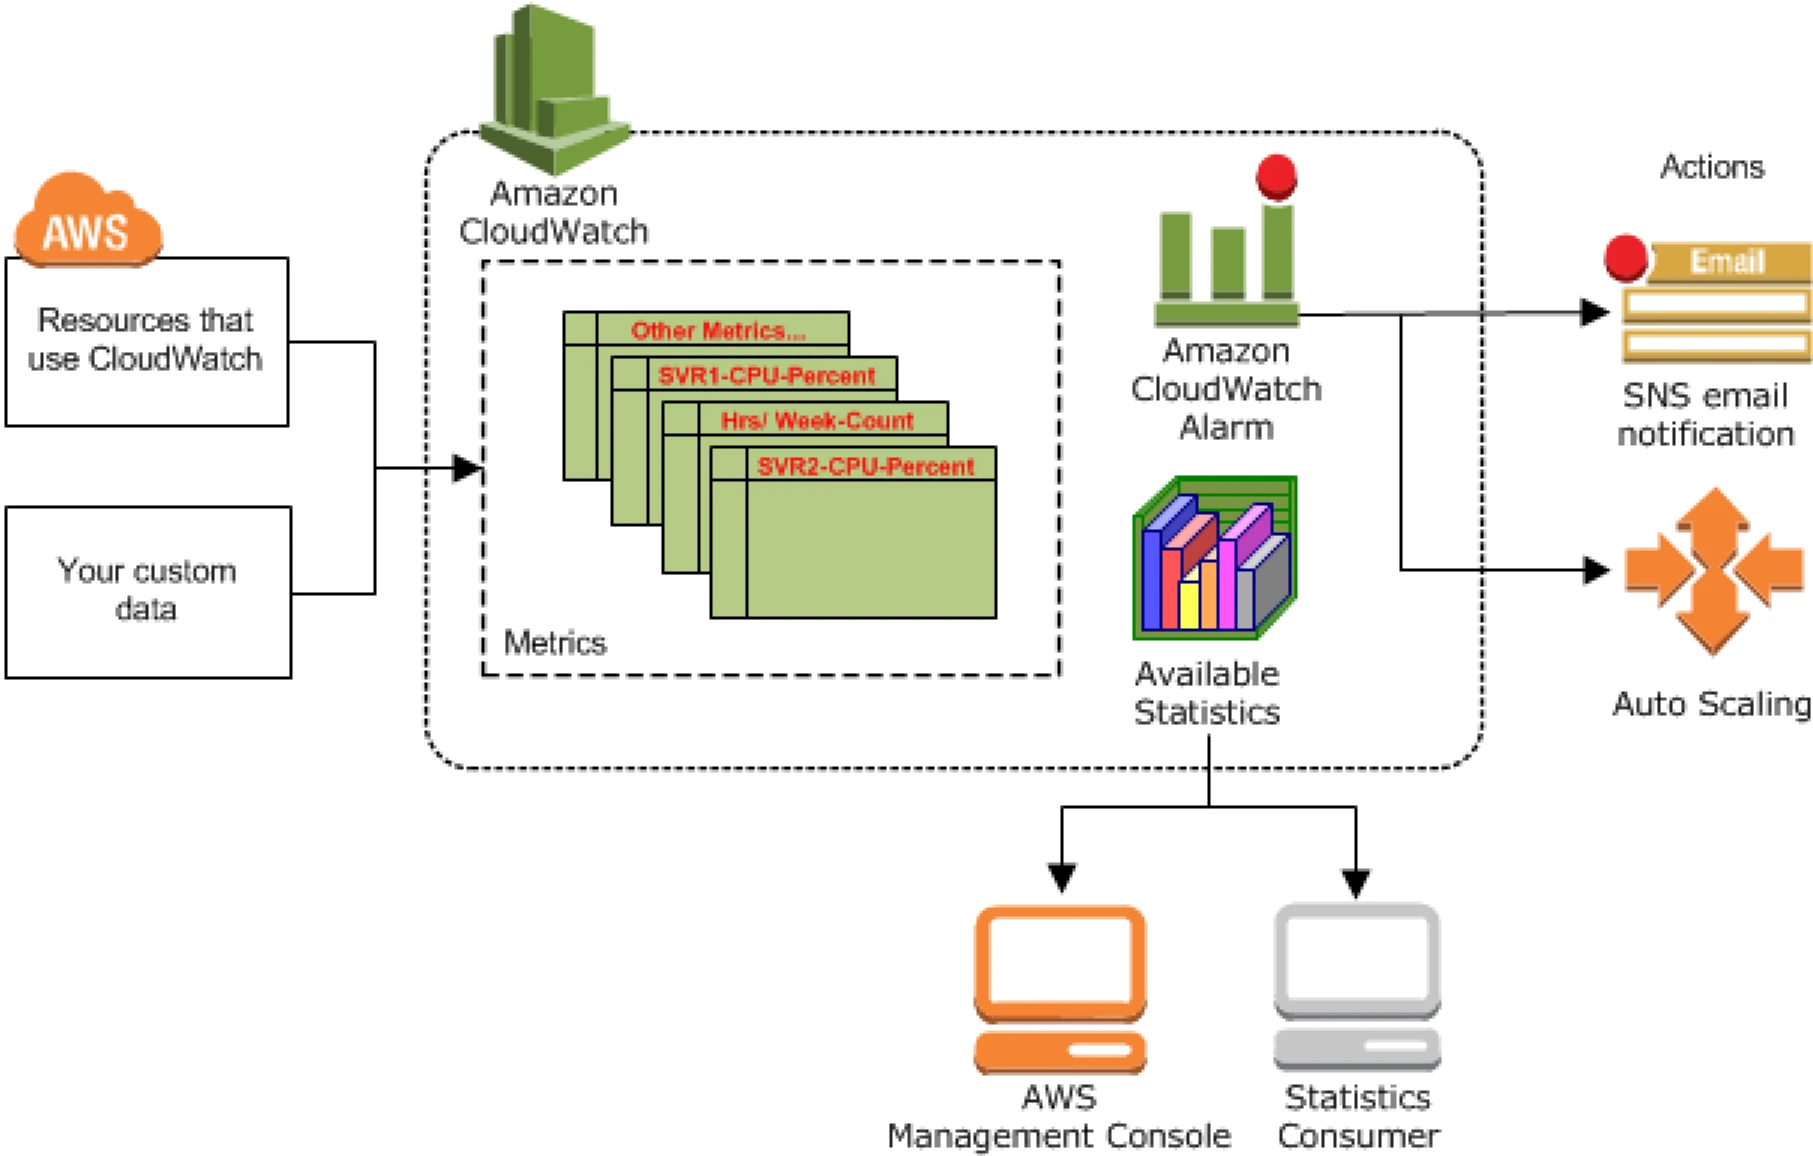
Working of AWS CloudWatch
An application or service publishes metrics (a set of data points ordered by time) in a namespace (a construct to provide isolation of metrics, for e.g., AWS/EC2 or AWS/APIGateway) with dimensions (an identity key/value pair used to filter and lookup metrics). Statistics are the aggregations performed over the reported unit (value) of the metrics over a period of time.
What is Prometheus?
Prometheus is an application used for monitoring and alerting, along with Grafana for dashboarding. It’s a popular and actively CNCF supported open source project, and it enjoys a lot of community support and integrations with other applications in the monitoring ecosystem.
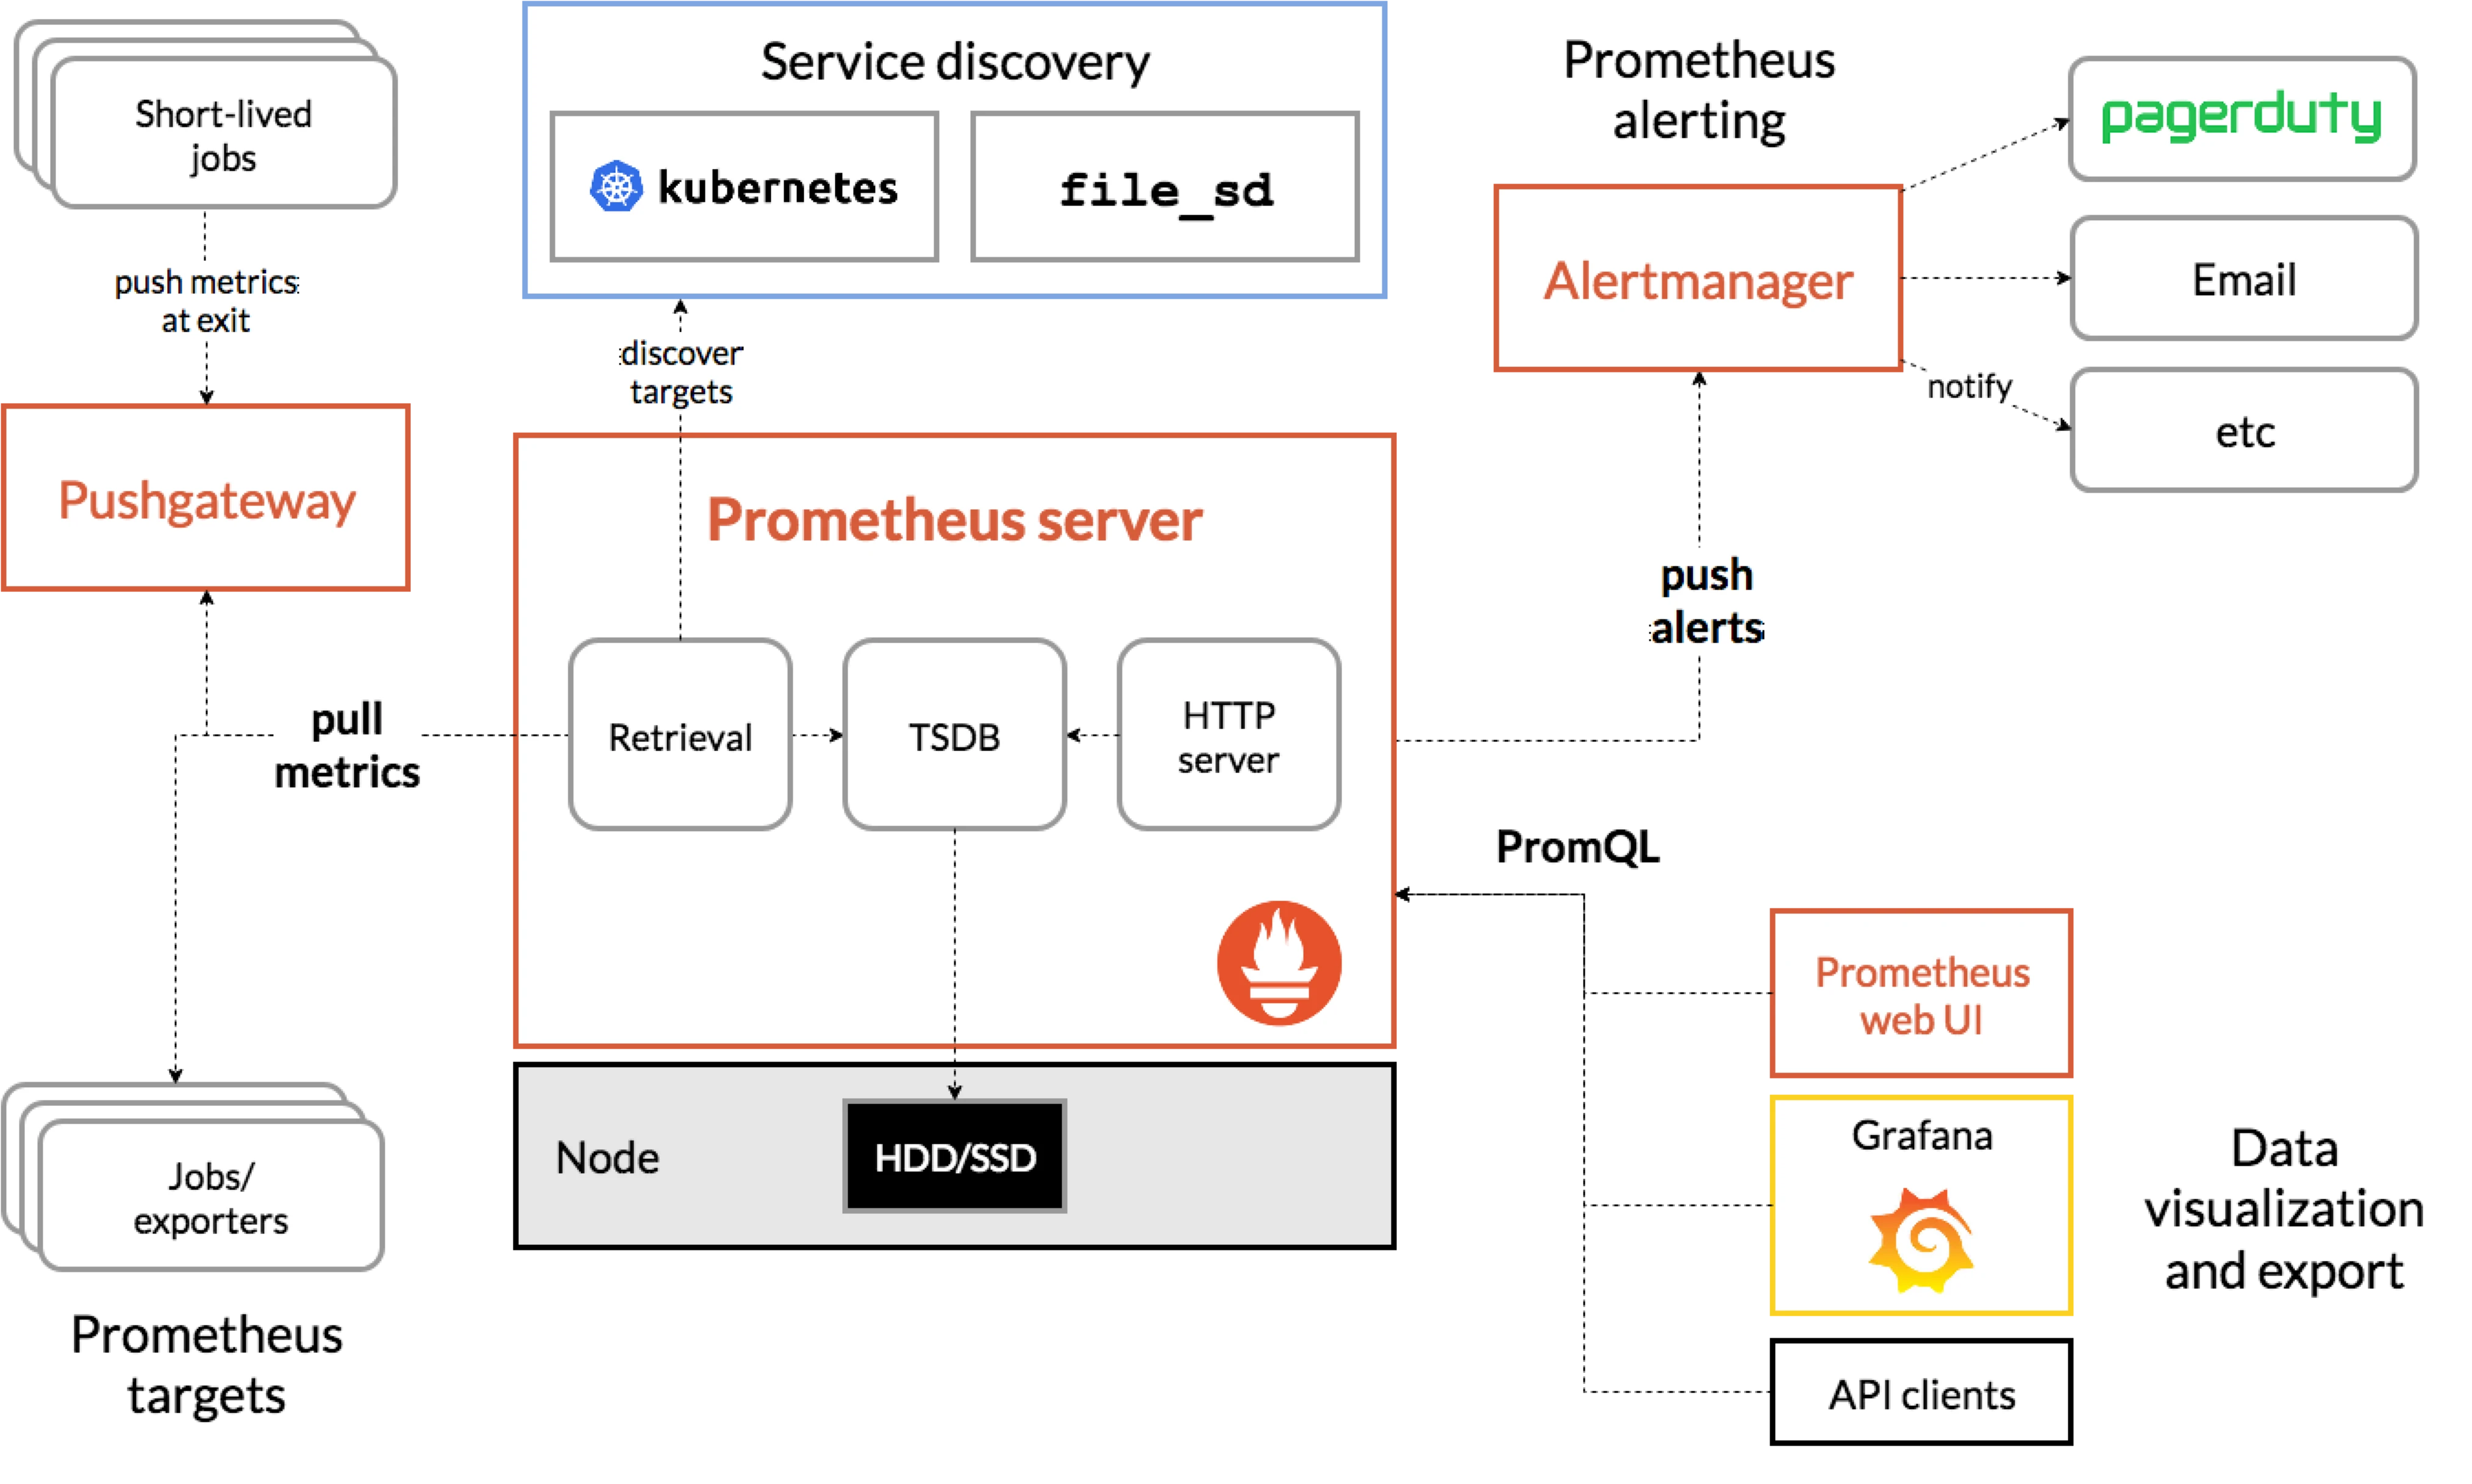
Working of Prometheus
An application exposes metrics (or uses the exporter to do so) at a specific endpoint scraped by the Prometheus server (this also acts as a sink for storing metric time-series data). Prometheus works on a pull-based mechanism where it scrapes metrics exposed by applications at a specific endpoint. It also supports a Push gateway component which is used to allow shortlived jobs such as cron and batch jobs to export their metrics. Prometheus exporters provide support for applications in exposing metrics in the Prometheus format. An Alert manager component provides support for managing alerts.
Amazon Managed Service for Prometheus (AMP)
Amazon Managed Service for Prometheus, is a fully managed, scalable, and highly available service that enables organizations to monitor their containerized applications. Built on the open-source Prometheus project, it allows users to ingest, store, query, and visualize time series metrics from various sources like Kubernetes clusters. AWS Managed Prometheus integrates seamlessly with AWS services like Amazon EKS, ECS, and Fargate, making it ideal for cloud-native environments. It helps users to observe their distributed applications without needing to handle the complexity of scaling or maintaining their Prometheus infrastructure. AWS also offers secure integration with IAM for fine-grained access control, making it easier to manage permissions.
Working of AMP
AWS Managed Prometheus works by ingesting metrics from Kubernetes clusters and other data sources through the Prometheus Remote Write API. AMP does not natively scrape operational metrics from containerized workloads in a Kubernetes cluster. Instead, users need to deploy and manage a standard Prometheus server or use an OpenTelemetry agent, such as the AWS Distro for OpenTelemetry Collector, within their cluster to handle the metric scraping. Once ingested, the metrics are stored in a scalable, multi-tenant, and highly available time-series database. Users can query the stored metrics using PromQL, Prometheus’ powerful query language, to analyze application performance and resource utilization. AWS handles all the infrastructure management tasks, such as scaling, patching, and backup. Users can visualize the metrics using Amazon Managed Grafana or other compatible dashboards.
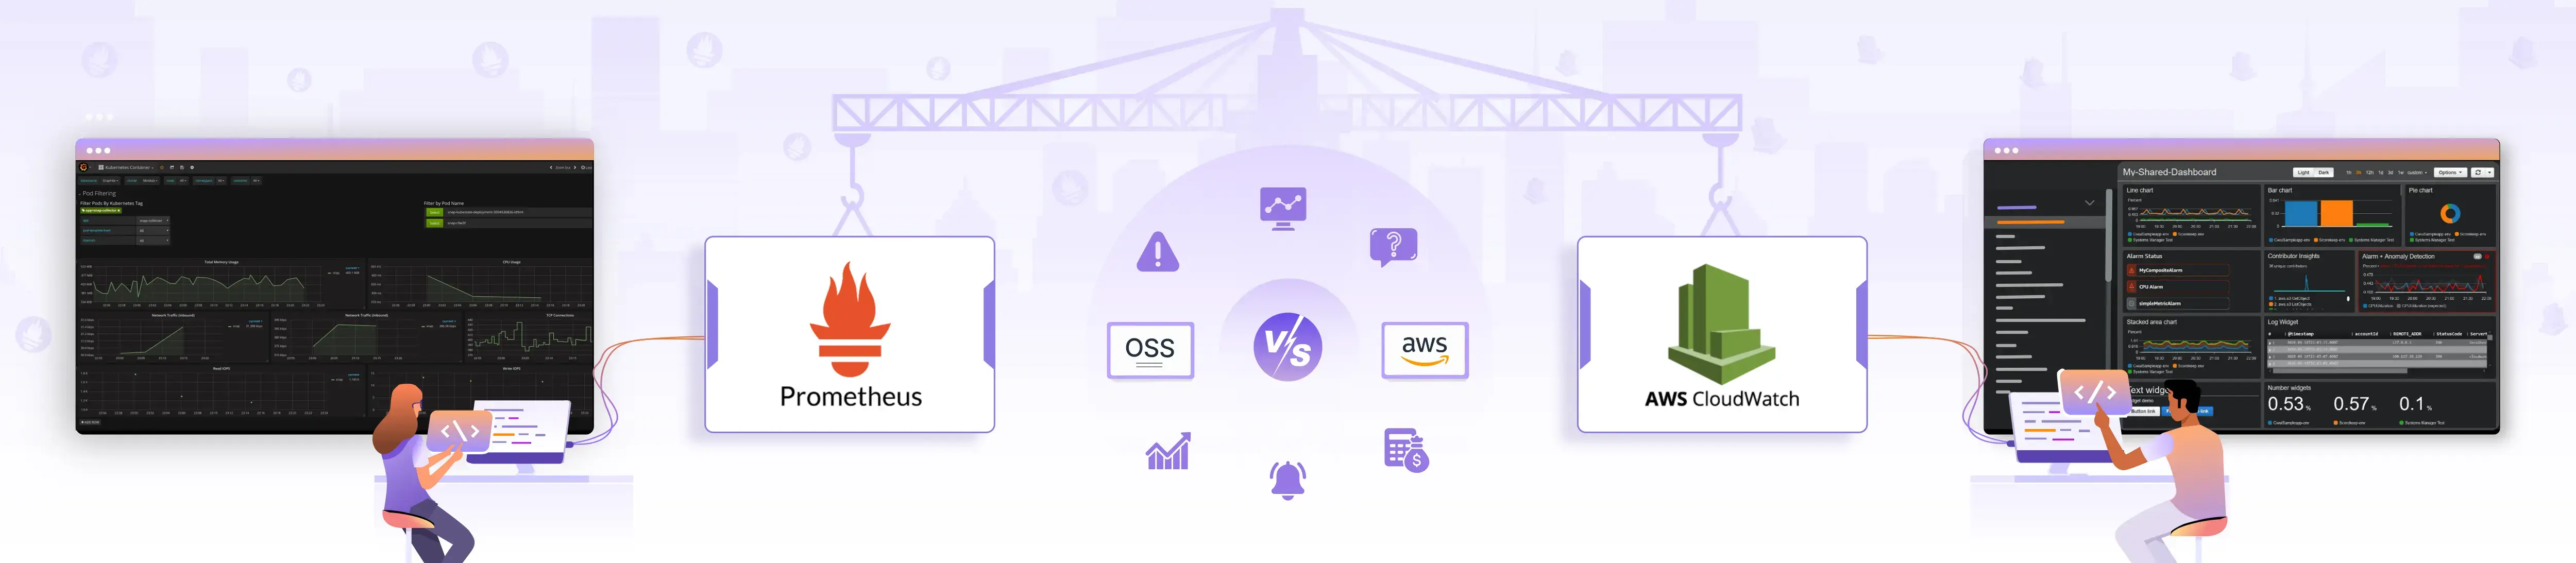
Let’s compare CloudWatch vs Prometheus
We will compare the two technologies primarily aimed at Kubernetes based cloud native platforms and explore which one fits the use cases better. One of the goals is also to find out the cost for each tool keeping the reference of a mid-sized cluster. When we say “cost” here, it is not just the $ value – there are multiple aspects to it. We will include a comparison table to give you a brief idea of cost incurred by all three tools.
Metric support in CloudWatch vs Prometheus
You can have core metric or custom metric at a standard resolution (granularity of a minute) or high resolution (granularity of a second). Specifically, for pod autoscaling to work, you will have to write an adapter and publish the metrics to the Kubernetes API server. From integration to other tools such as PagerDuty, etc., you will have to integrate using AWS SQS or similar tooling.
Prometheus supports scraping Kubernetes metrics natively and is well integrated with the API server for autoscaling. It also comes with support for custom metrics, and the most commonly used use cases will have a community developed adapter ready to use.
One of the areas where CloudWatch still needs to be used in combination with Prometheus is for managed services such as RDS. The metrics from RDS are directly exported to CloudWatch, and from there, you can use a Prometheus exporter to push metrics to Prometheus.
Alerting in Prometheus vs CloudWatch
Alerting in Prometheus and Amazon CloudWatch takes different approaches suited to their ecosystems. Prometheus uses Alertmanager to handle alerts based on custom PromQL queries, offering flexibility in defining rules and integrating with various notification channels like Slack and email. This setup is ideal for complex, dynamic environments. Note that AMP will also have similar approach but by using Alertmanager from Amazon managed Grafana service. CloudWatch, on the other hand, employs CloudWatch Alarms to monitor metrics and logs, triggering notifications or automated actions when thresholds are met. It integrates with AWS services and supports notifications through Amazon SNS and automated responses via AWS Lambda. While CloudWatch provides a seamless experience within AWS, Prometheus excels with its granular, flexible alerting capabilities that are suitable for diverse or multi-cloud setups.
Querying and Dashboarding in Prometheus vs CloudWatch
Querying and Dashboarding is one area where Prometheus – with Grafana as the dashboarding tool and Prometheus query language wins hands down. With dashboards that are beautifully backed by a query language that is rich, the dashboarding in Prometheus world is far better. Also, CloudWatch and Amazon managed Grafana do charge for each additional dashboard, and in a self-managed Prometheus setup, there is no reason not to create a dashboard if you need to.
The big question: Cost! in CloudWatch vs Prometheus
One of the final areas that we want to discuss is the cost comparison of using all the three tools that we are discussing in post. The cost here is not just the dollar value paid for infrastructure but also the engineering and skill cost of the engineering bandwidth. There are also other aspects, such as cloud lock-in, multi-cloud deployments, hybrid deployments, etc. Let’s start with pure data-driven costs and then dive into other areas. Please note that the cost comparison is done based on the pricing of CloudWatch and Prometheus in September 2024 and should be confirmed before making a business decision
When evaluating Prometheus and CloudWatch for Kubernetes monitoring, it’s helpful to start with a few assumptions based on a medium-sized organization operating in a single environment. For this comparison, we’ve used data from a 100-node Amazon EKS (Elastic Kubernetes Service) cluster with over 4,000 running pods.
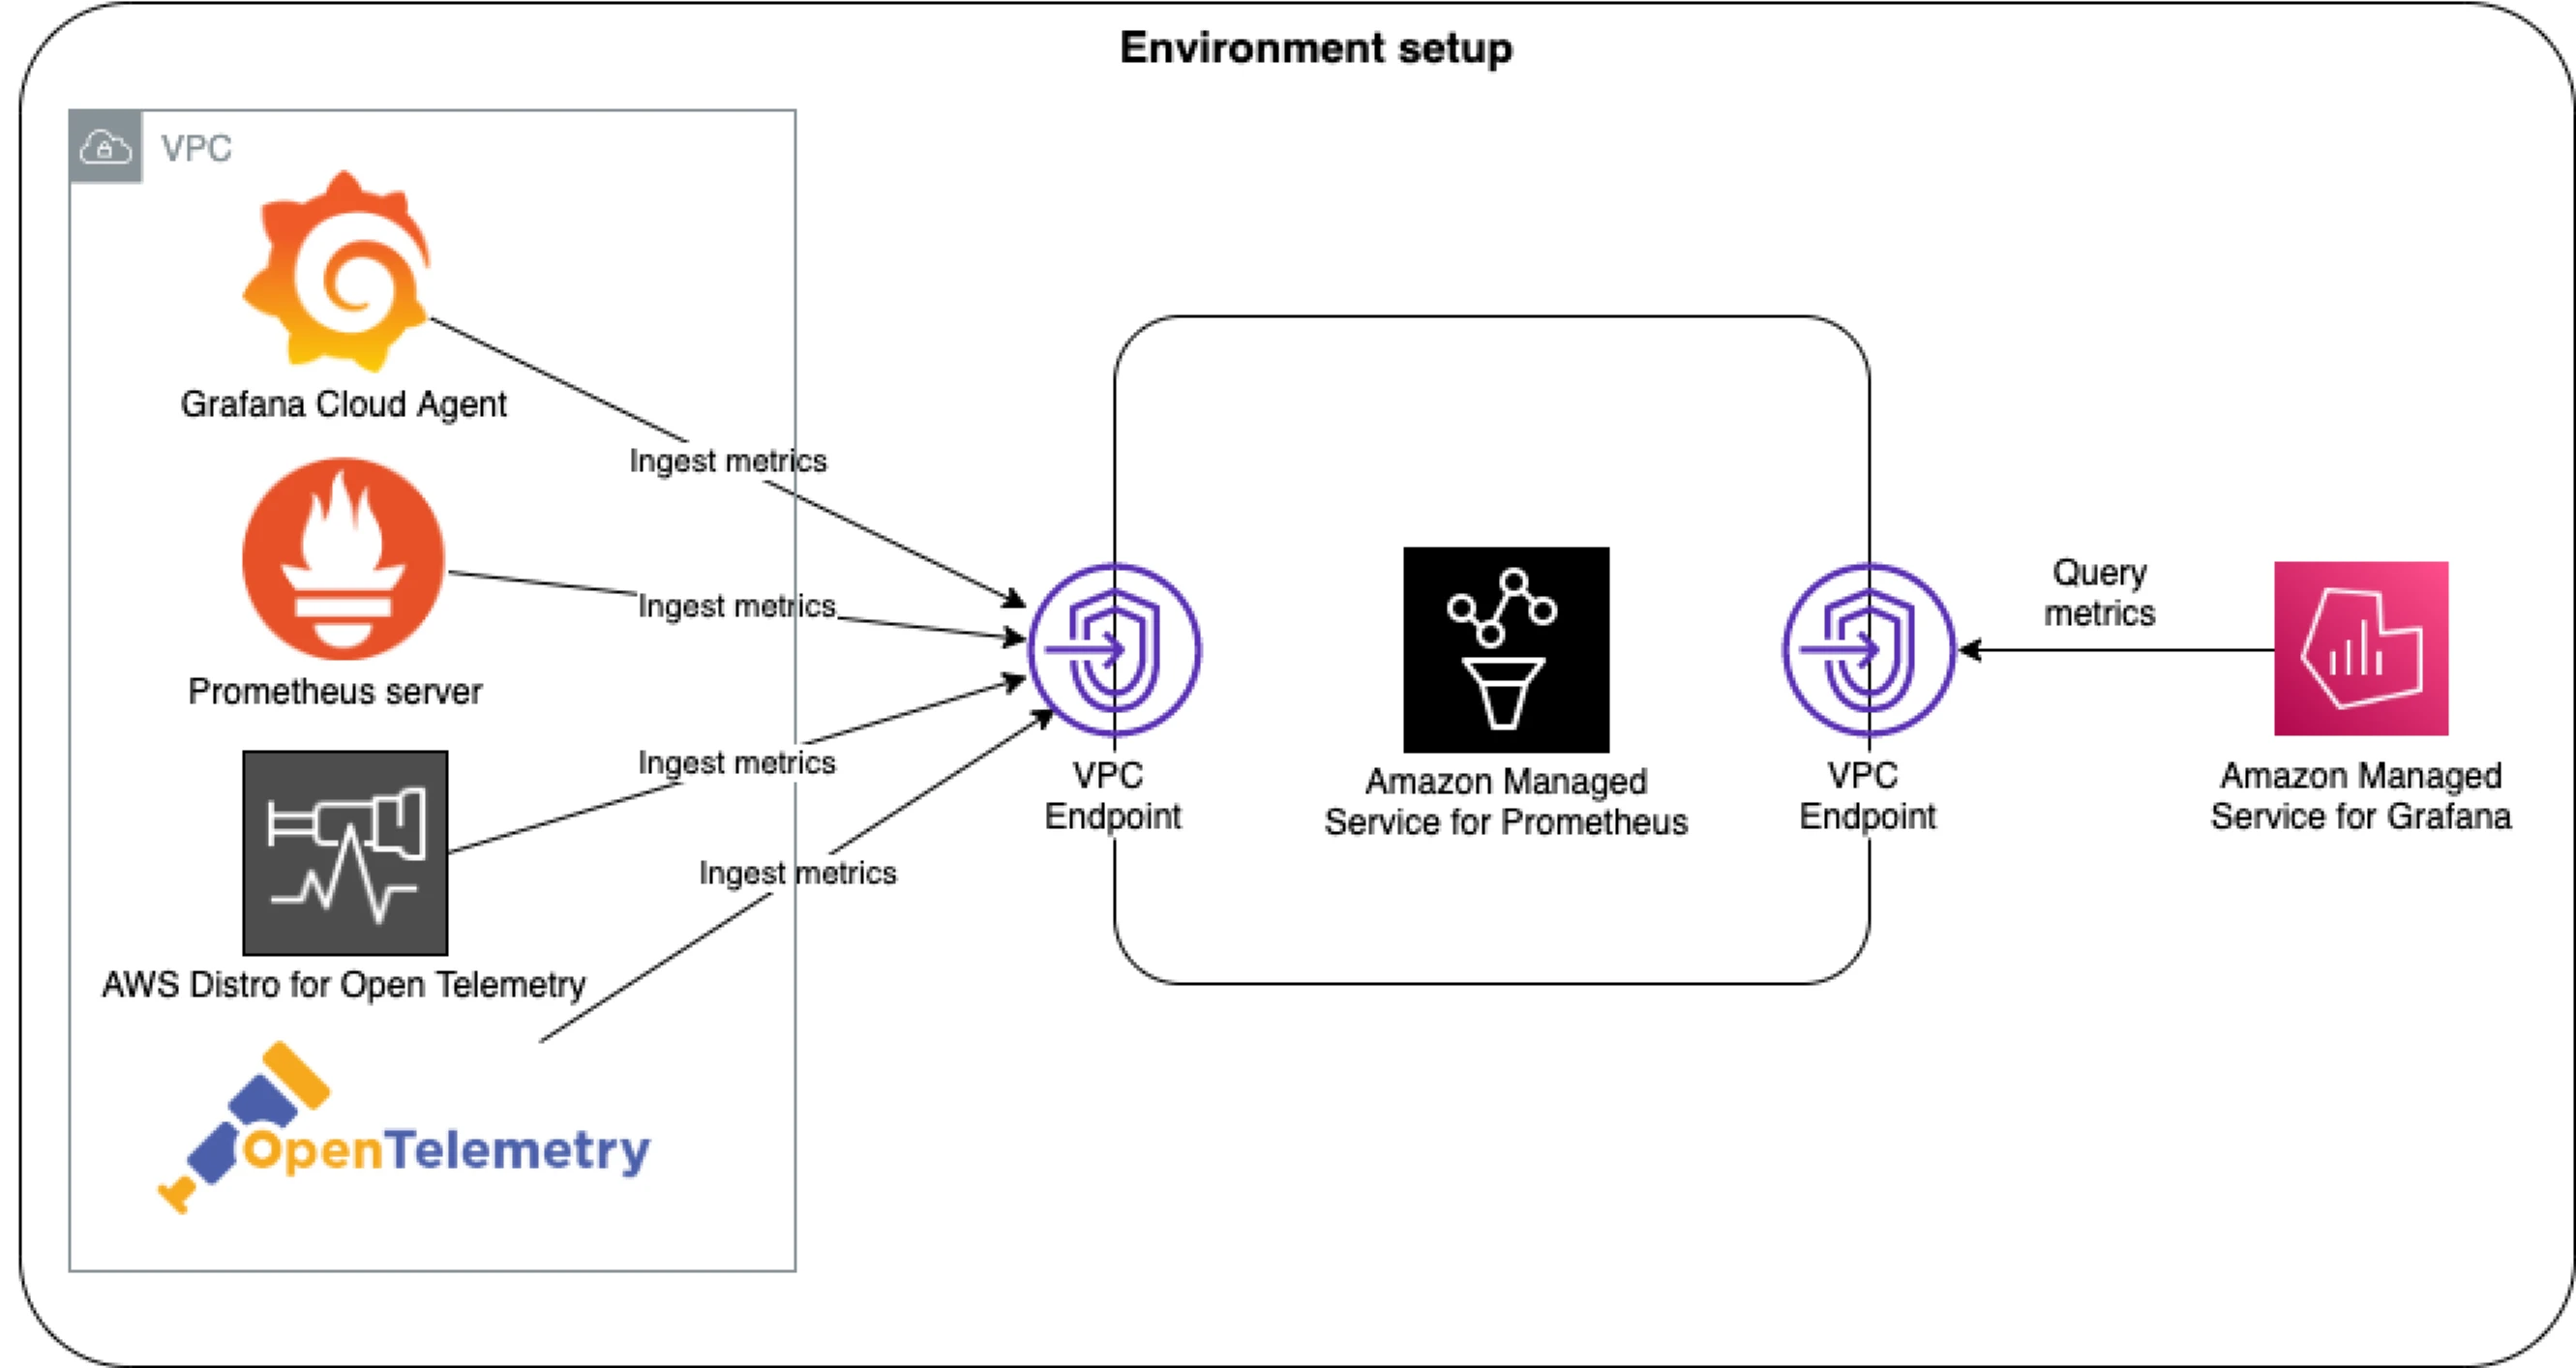
Environment setup
CloudWatch
- Deployment: Amazon CloudWatch Agents are deployed as DaemonSets on all nodes in the cluster.
- Metrics collection: These agents collect cluster metrics and export them to the ContainerInsights namespace in CloudWatch.
- Retention period: CloudWatch retains these metrics for approximately 63 days with a scraping interval of 5 minutes.
- Metric count: For our EKS cluster, we recorded around 19,000 metrics across various namespaces, such as ContainerInsights, EC2, AutoScaling Group, and EBS.
Prometheus and Thanos
- Deployment: Prometheus is deployed on the EKS cluster alongside Thanos for long-term storage, along with all other components, including node exporters.
- Retention period: Prometheus is configured with a 3-day in-memory retention period for metrics. Thanos then stores these metrics in an Amazon S3 bucket for long-term storage (for our comparison, it will be for 2 months).
We compared the two metrics monitoring tools with a reference setup of 100 nodes and a storage duration of 60 days (2 months). Below is a summary of key parameters used for this comparison:
| Parameter | Prometheus | CloudWatch | AMP |
| Number of Nodes | 100 | 100 | 100 |
| Time Series Definition | Metrics x labels | Namespace x Metrics x dimension | Metrics x labels |
| Time Series | ~1.5 M | ~19 K | ~1.5 M |
| Metrics Storage Duration | 60 days | 60 days | 60 days |
| Scrape Duration | 20 s | 5 min | 20 s |
Since CloudWatch is a managed service, there is minimal overhead in managing resources, aside from the CloudWatch Agent DaemonSets. In contrast, using Prometheus requires managing the Prometheus and Thanos StatefulSets, as well as additional components like Node Exporter DaemonSets for scraping cluster metrics. The table below highlights the major components to consider for resource management.
| Resource | Prometheus | CloudWatch | AMP |
| Agents (DaemonSets) | 1 GiB x 100 Nodes | 512 MiB x 100 Nodes | 1 GiB x 100 Nodes |
| Prometheus Pod | ~25 GiB | Not Applicable | Not Applicable |
| Retention Period | 3 days | ||
| Prometheus EBS Storage | ~40 GiB | ||
| Thanos Pod | ~20 GiB | ||
| Thanos EBS Storage | ~40 GiB | ||
| S3 Storage | ~1 TB (500 MB x 2months) |
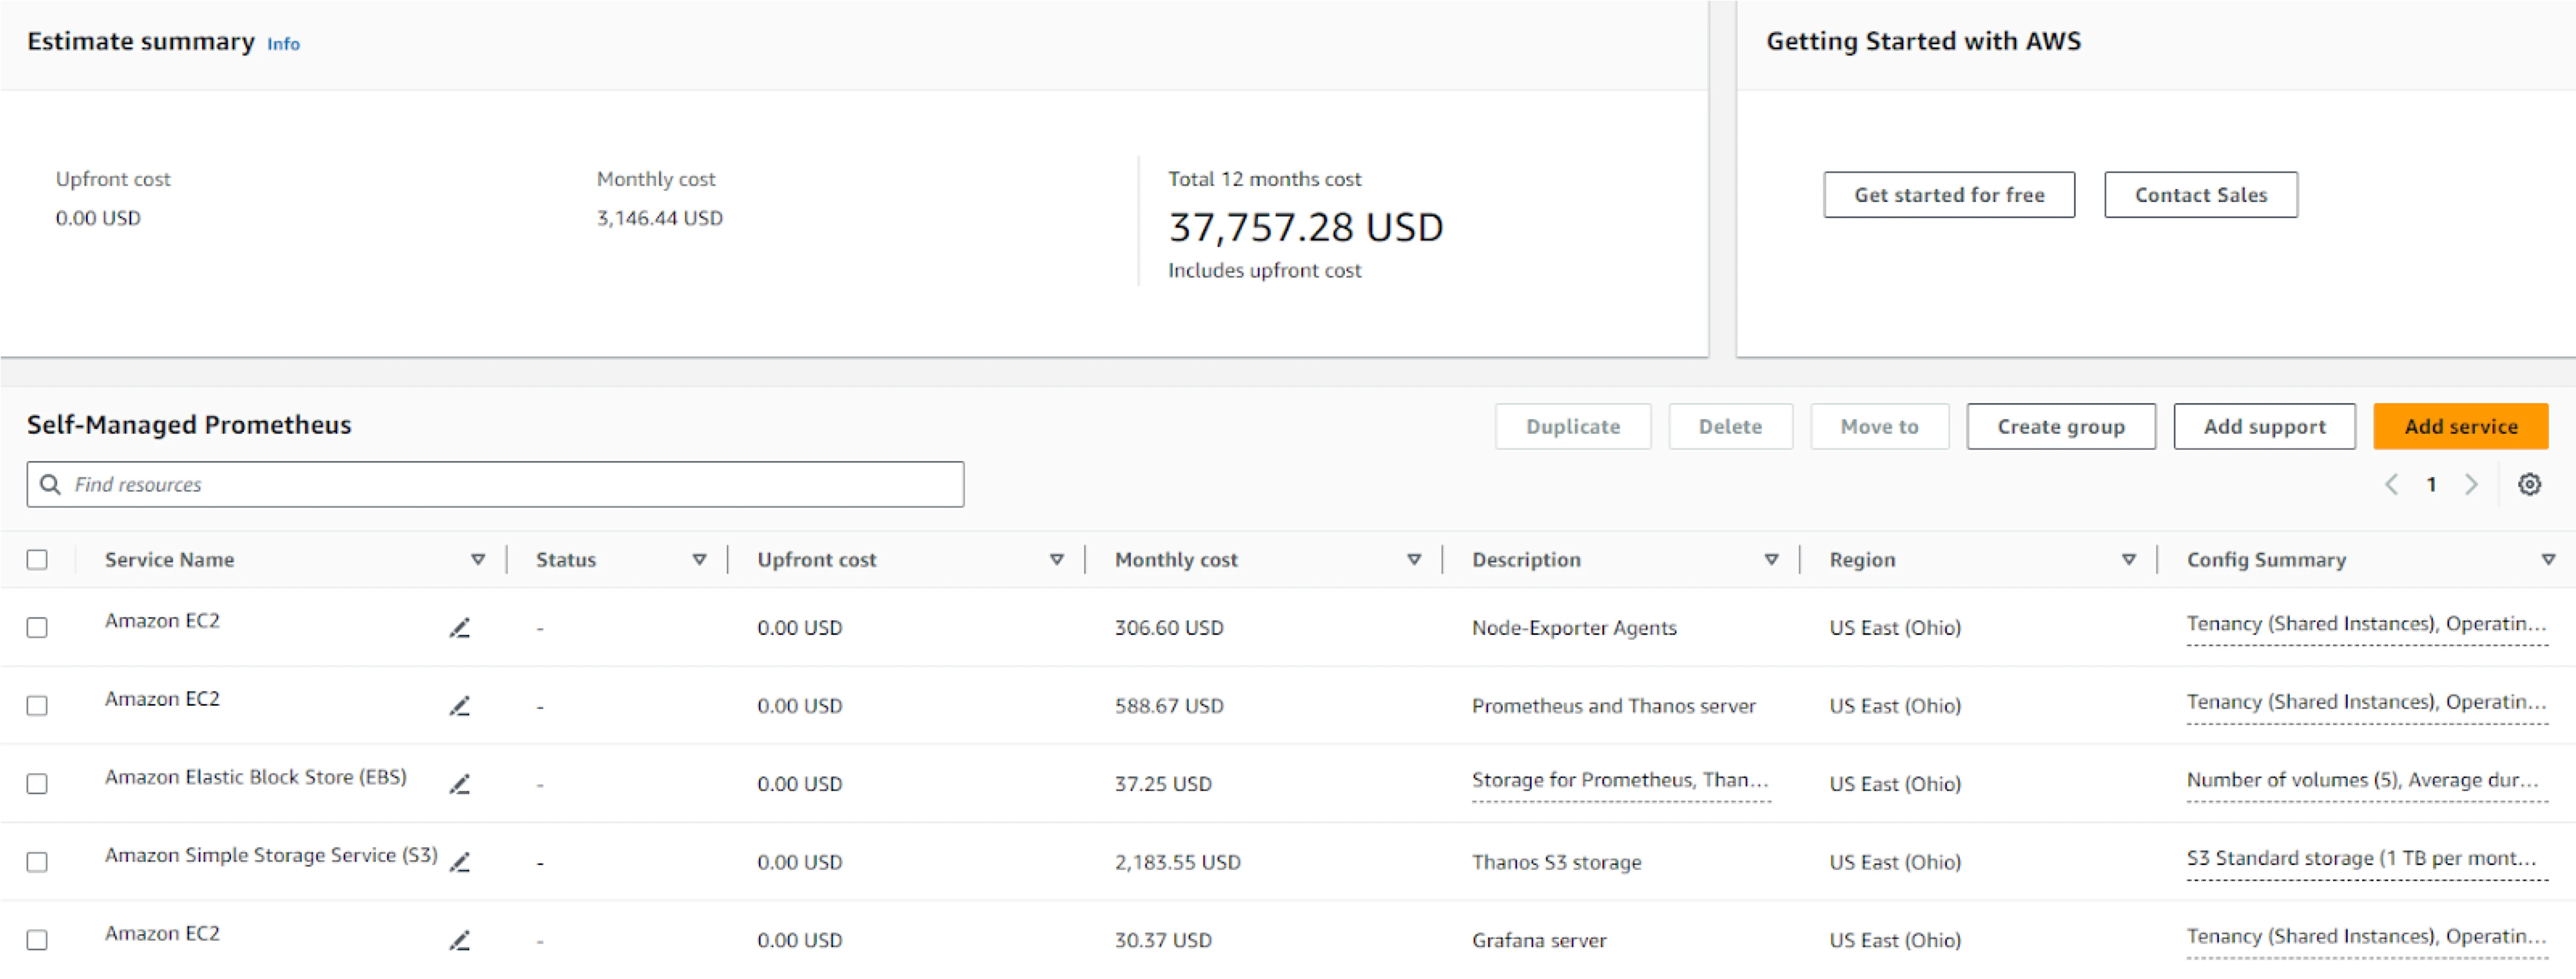
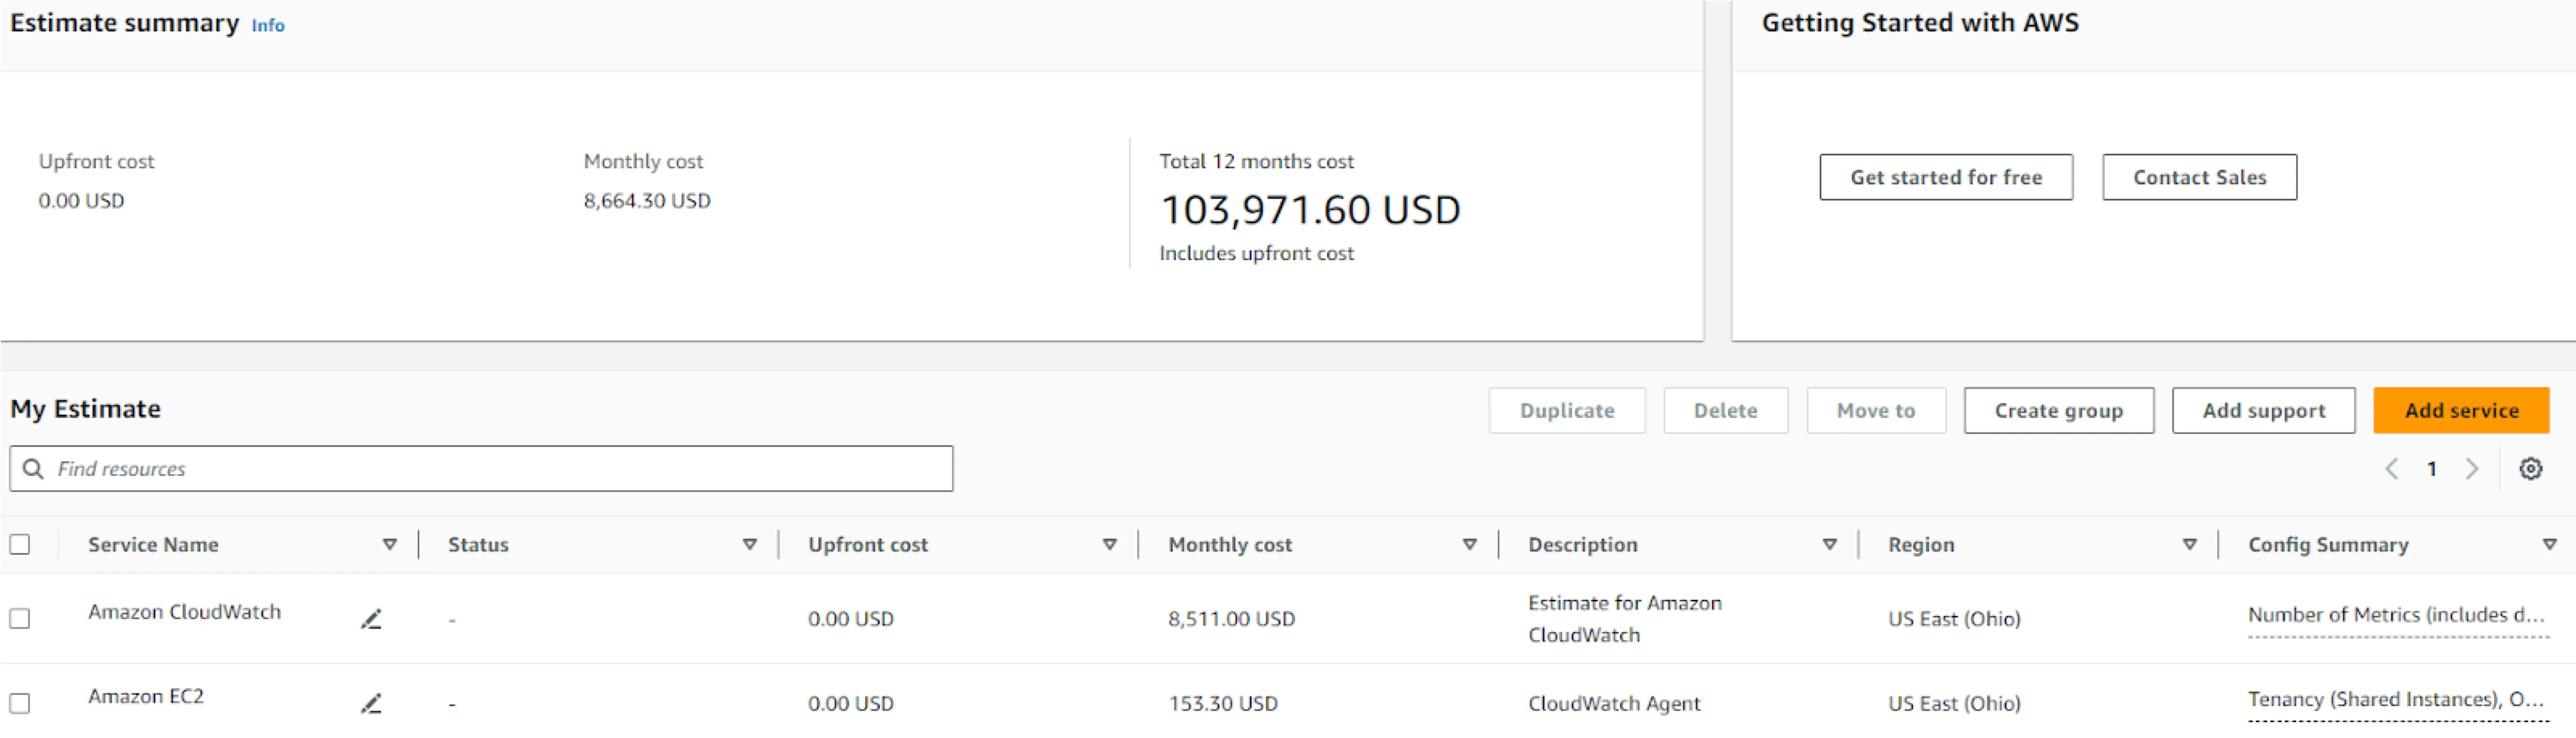
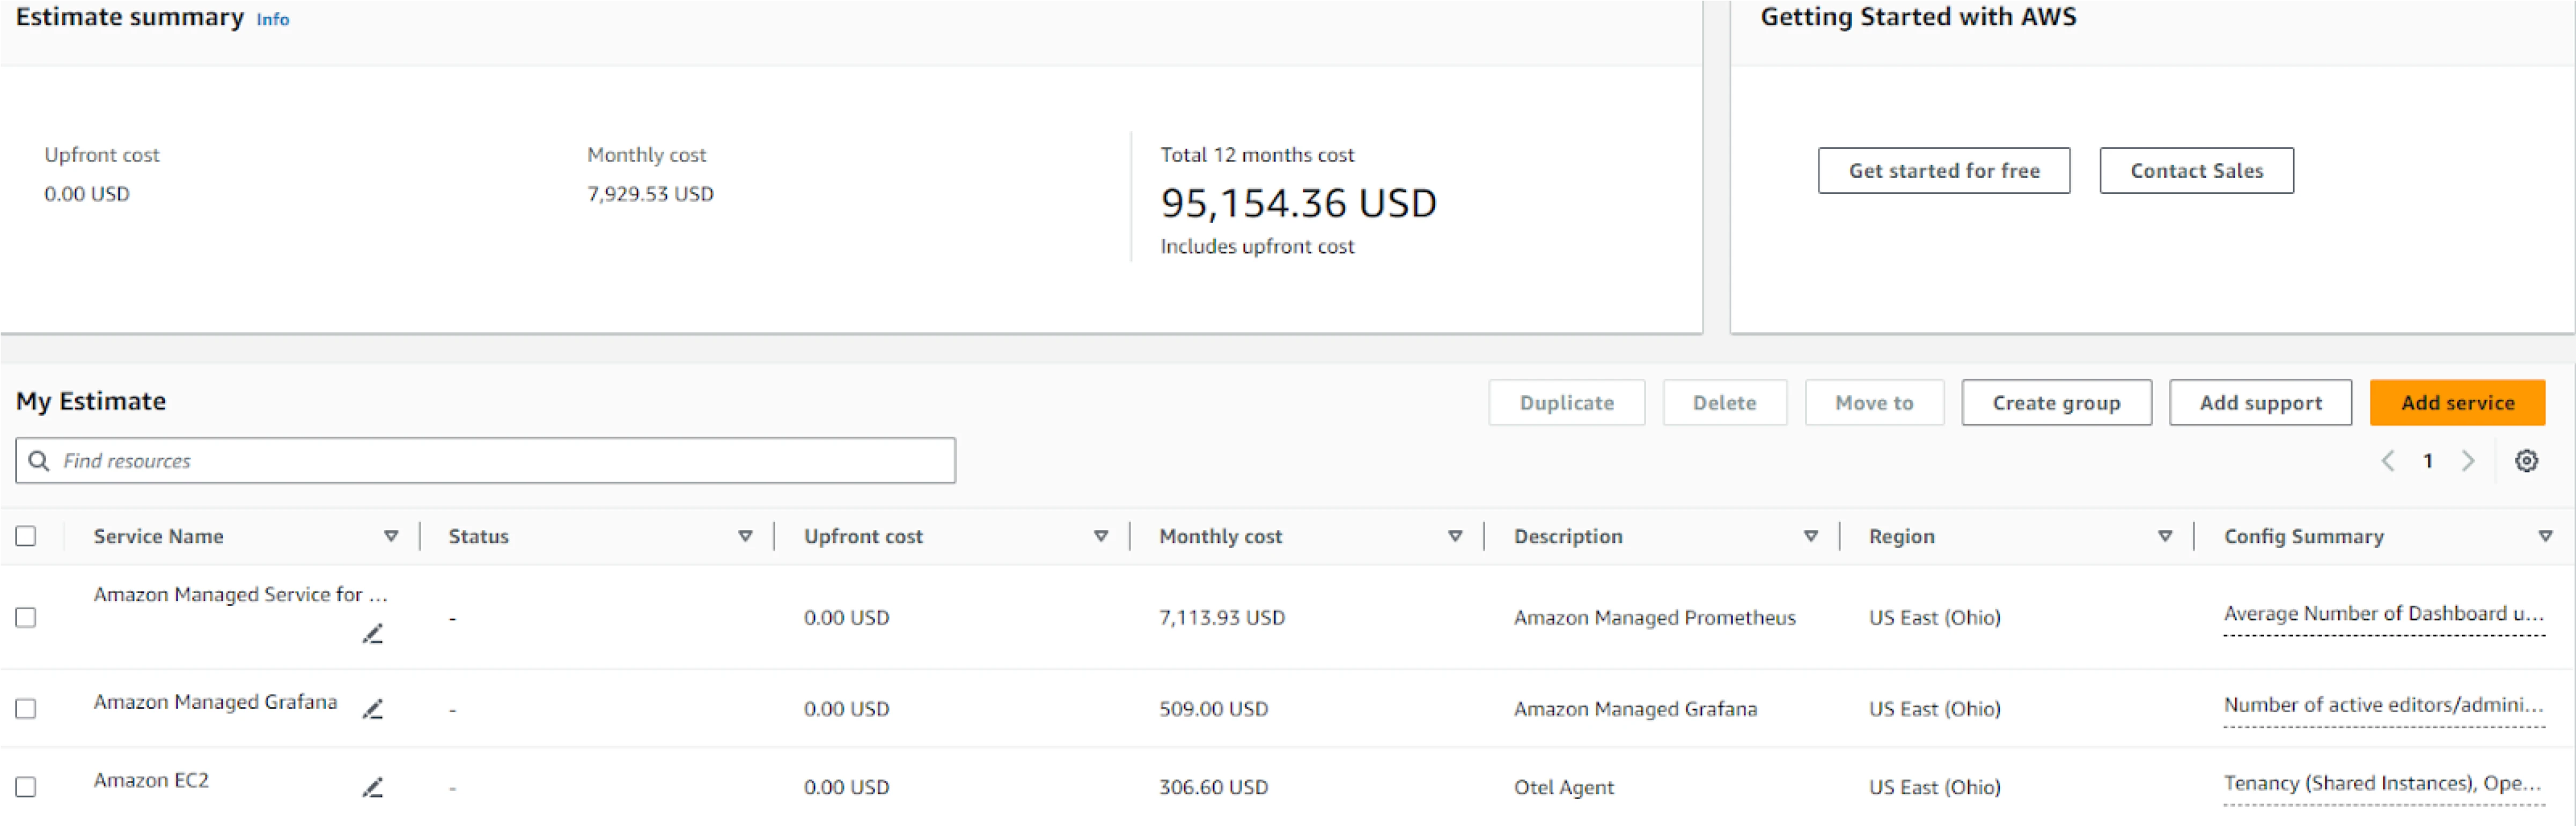
Based on these resources, we conducted a cost analysis. For CloudWatch, the cost calculation is straightforward and can be directly estimated using the AWS Cost Calculator by inputting the number of metrics. We included the cost of the agents, assuming a t4g.nano instance type, which offers the lowest cost for provisioning 512 MiB of memory. For Prometheus and Thanos, we used r6g.2xlarge instances to accommodate both StatefulSets. For node exporters, we assumed t4g.nano instances, which provide the lowest cost for provisioning 1 GiB of memory. EBS and S3 storage costs were calculated according to the resource usage mentioned in the table above. The following table presents a cost comparison of the two methods under discussion.
| Cost Component | Prometheus | CloudWatch | AMP |
| Agents | $613.2 (Considering t4g.micro instance) | $306.6 (Considering t4g.nano instance) | $613.2 (Considering t4g.micro instance) |
| AWS Calculator Estimate | Not Applicable | $7,800 | $14,227.86 |
| Instance (r6g.2xlarge for 2 monthsx 2 instances) | $1,177.34 | Not Applicable | Not Applicable |
| S3 | $47.1 | ||
| EBS | $59.6 | ||
| Total Cost | $1,897.24 | $8,106.60 | $14,841.06 |
When considering monitoring tools, it’s crucial to factor in the cost of dashboards and visualizations, as they play a significant role in monitoring effectiveness. The cost can vary based on how often metrics are fetched and displayed. When considering the cost of monitoring and visualization, it’s important to account for the number of requests made to fetch metrics each month. Let’s break this down with some assumptions. Suppose you have 100 dashboards, each used by 100 users, and each dashboard refreshes every minute. This means each dashboard generates 60 requests per hour, resulting in 1,440 requests per day. Over a month, this totals around 432 million requests (60 requests/hour × 24 hours/day × 30 days × 100 dashboards × 100 users).
| Parameters | Prometheus | CloudWatch | AMP |
| Monthly requests | 432 million requests | ||
| Grafana | T3.medium (Self-managed), $30.37 | NA | Considering AWS managed Grafana |
| EBS (Volume for Grafana) | $7.45 | NA | NA |
| S3 | $2,160 (PUT, COPY, POST, LIST requests to S3 Standard) | NA | NA |
| AWS Calculator Estimate | NA | 432M (GetMetricData: Number of metrics requested) \ 291 (100 dashboards) | $509 (1 Admin and 100 viewers) |
| Total | $2197.82 | $4611 | $509 |
| Total (2months) | $4395.64 | $9222 | $1,018 |
| Total with Metrics (from previous table) | $6292.88 | $17,328.6 | $15,859.06 |
| Monthly Cost | $3,146.44 | $8,664.3 | $7,929.53 |
These pricing estimates are provided as json here.
To be fair, this is, again, not an exact apple-to-apple comparison. The cost of engineering effort and skills to run self-managed Prometheus has to be accounted for. Also, the cost of instances considered here is for on-demand and might vary for reserved or spot instances, which have lower costs – and that is something we are not taking into account. Overall, it is clear from the calculation that the cost of running a self-managed Prometheus stack gets cheaper beyond a certain threshold.
Disclaimers:
-
Pricing estimates: The prices mentioned in this blog are calculated using the AWS Pricing Calculator and are accurate as of the time of writing. However, AWS pricing may change over time, so it’s recommended to verify current costs through the AWS Pricing Page or directly in the AWS Pricing Calculator.
-
Discounts and offers: AWS frequently offers discounts or credits, especially for long-term commitments (e.g., Reserved Instances or Savings Plans). Depending on the usage and business agreements, the actual cost may be lower than the on-demand pricing used in this comparison.
-
Additional costs: This comparison focuses on the core infrastructure and monitoring services. Additional services such as data transfer, storage, or advanced features (like cross-region metrics replication or higher retention periods) might incur extra costs, depending on the specific use case and setup.
Key takeaways - Prometheus Vs CloudWatch
- If you are starting out a new organization or a new product – you definitely might want to use a managed service such as CloudWatch or Amazon-managed Prometheus.
- Once you start embracing cloud-native technologies and also thinking of multi-cloud or cloud-agnostic infrastructure, then it is better to start thinking about Prometheus.
- If you are doing anything of non-trivial scale – there might be benefits to using Prometheus. The benefits can be economic as well as beyond economics, such as feature richness.
- For some AWS managed services, such as RDS – you will need to use CloudWatch for native monitoring and then use Prometheus exporters to get the data into Prometheus servers.
We would love to hear the stories of using CloudWatch vs Prometheus or other services and how you make the decision of choosing one over the other. Let’s start a conversation with Hrishikesh or Ruturaj.
Looking for help with observability stack implementation and consulting? Do check out how we’re helping startups & enterprises as an observability consulting services provider.
Stay updated with latest in AI and Cloud Native tech
We hate 😖 spam as much as you do! You're in a safe company.
Only delivering solid AI & cloud native content.
Posts You Might Like