Root Cause Chronicles: Connection Collapse

On a usual Friday evening, Robin had just wrapped up their work, wished their colleagues a happy weekend, and turned themselves in for the night. At exactly 3 am, Robin receives a call from the organization’s automated paging system, “High P90 Latency Alert on Shipping Service: 9.28 seconds”.
Robin works as an SRE for Robot-Shop, an e-commerce company that sells various robotics parts and accessories, and this message does not bode well for them tonight. They prepare themselves for a long, arduous night ahead and turn on their work laptop.
Setting the field
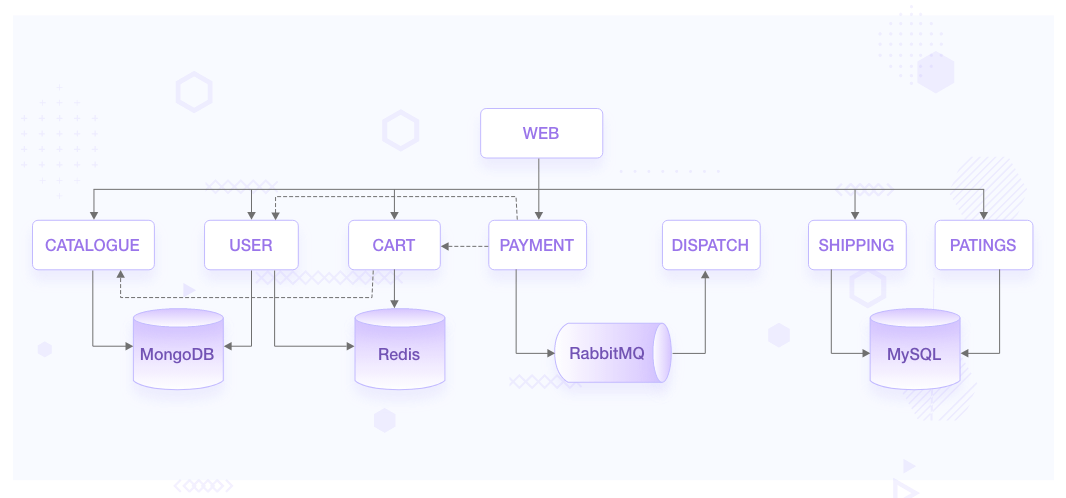
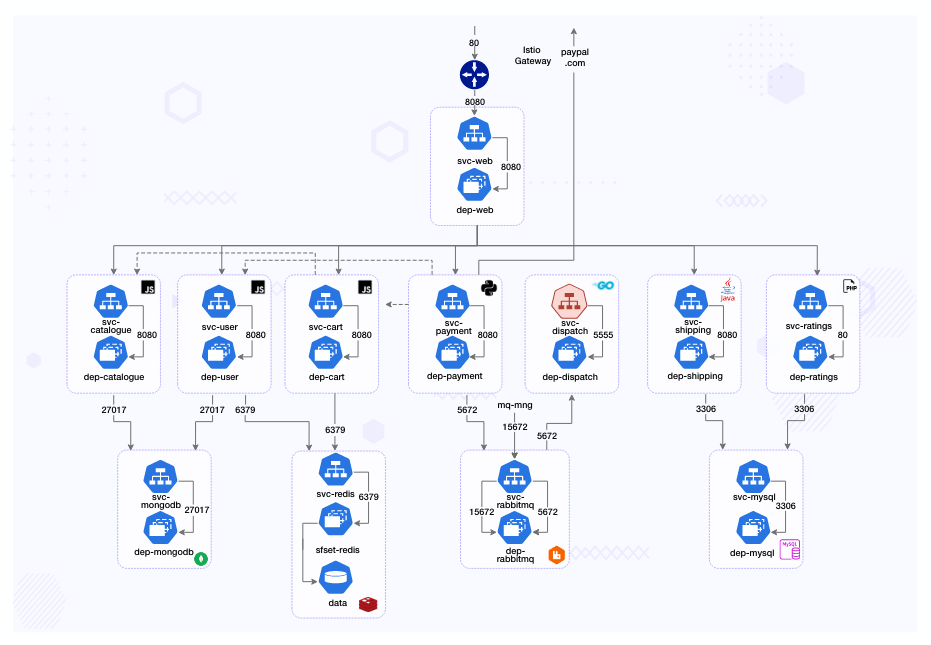
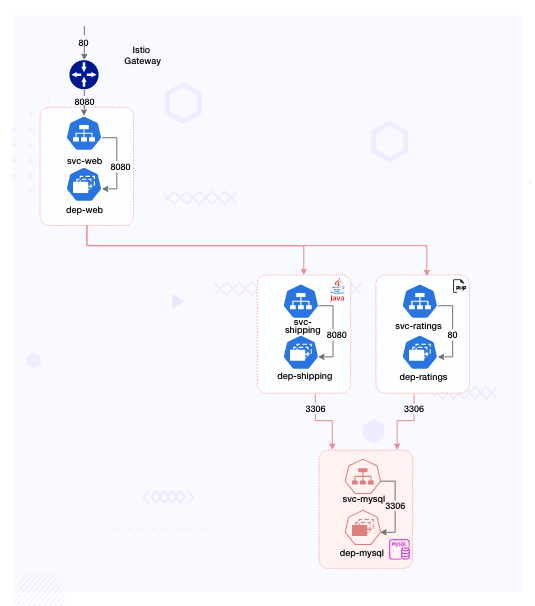
Robot-Shop runs a sufficiently complex cloud native architecture to address the needs of their million-plus customers.
- The traffic from load-balancer is routed via a gateway service optimized for traffic ingestion, called Web, which distributes the traffic across various other services.
- User handles user registrations and sessions.
- Catalogue maintains the inventory in a MongoDB datastore.
- Customers can see the ratings of available products via the Ratings service APIs.
- They choose products they like and add them to the Cart, a service backed by Redis cache to temporarily hold the customer’s choices.
- Once the customer pays via the Payment service, the purchased items are published to a RabbitMQ channel.
- These are consumed by the Dispatch service and prepared for shipping. Shipping uses MySQL as its datastore, as does Ratings.
Troubles in the dark
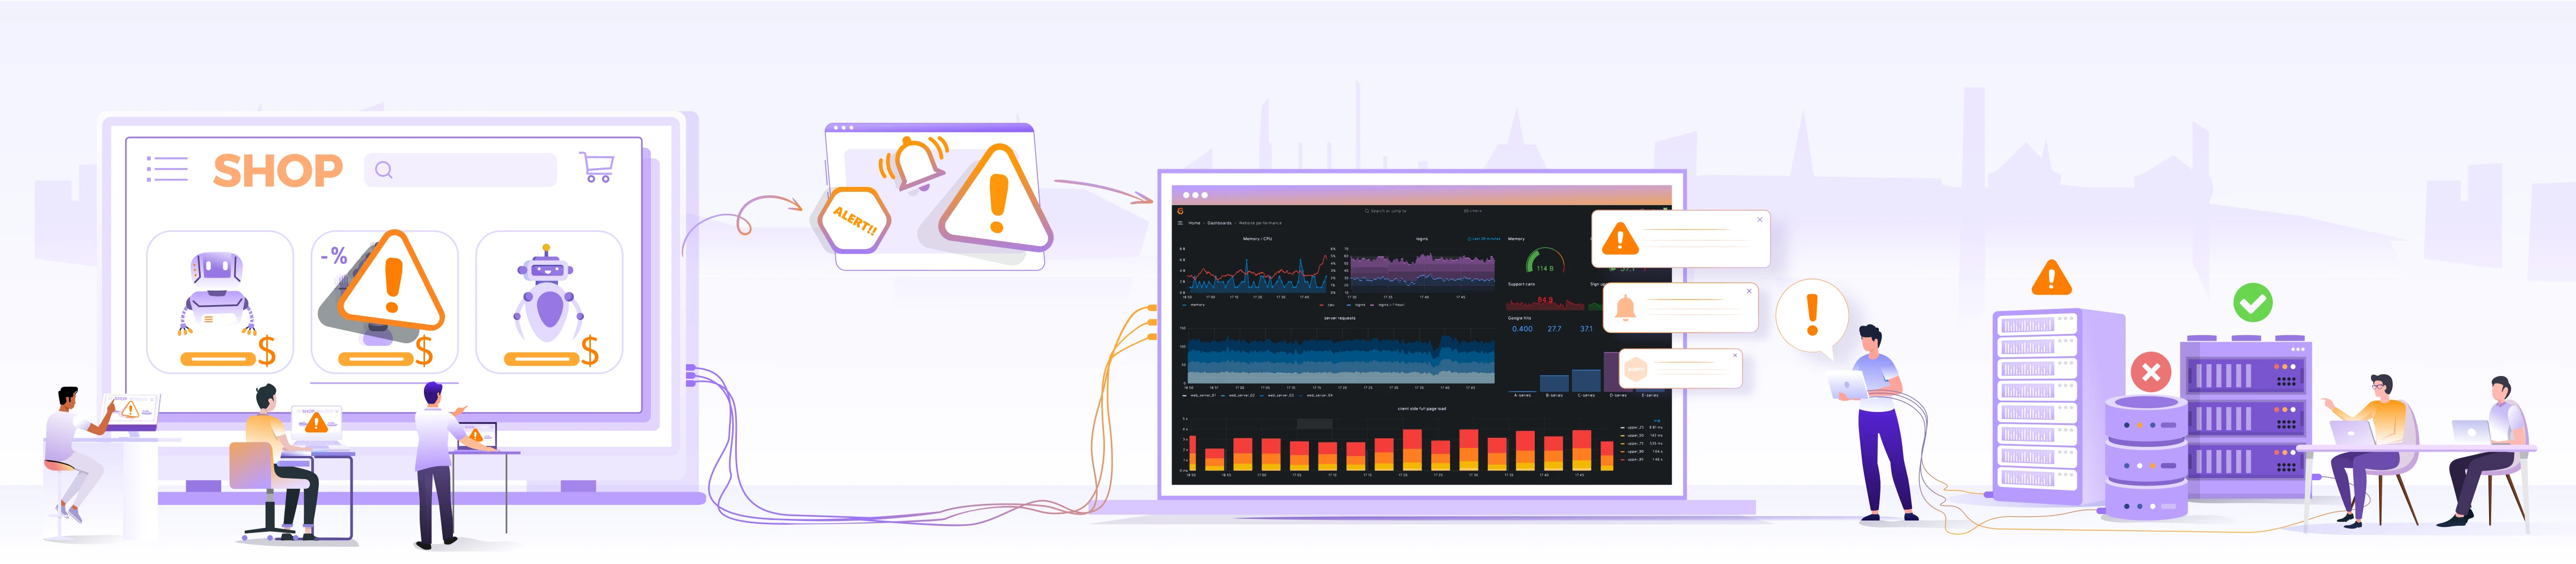
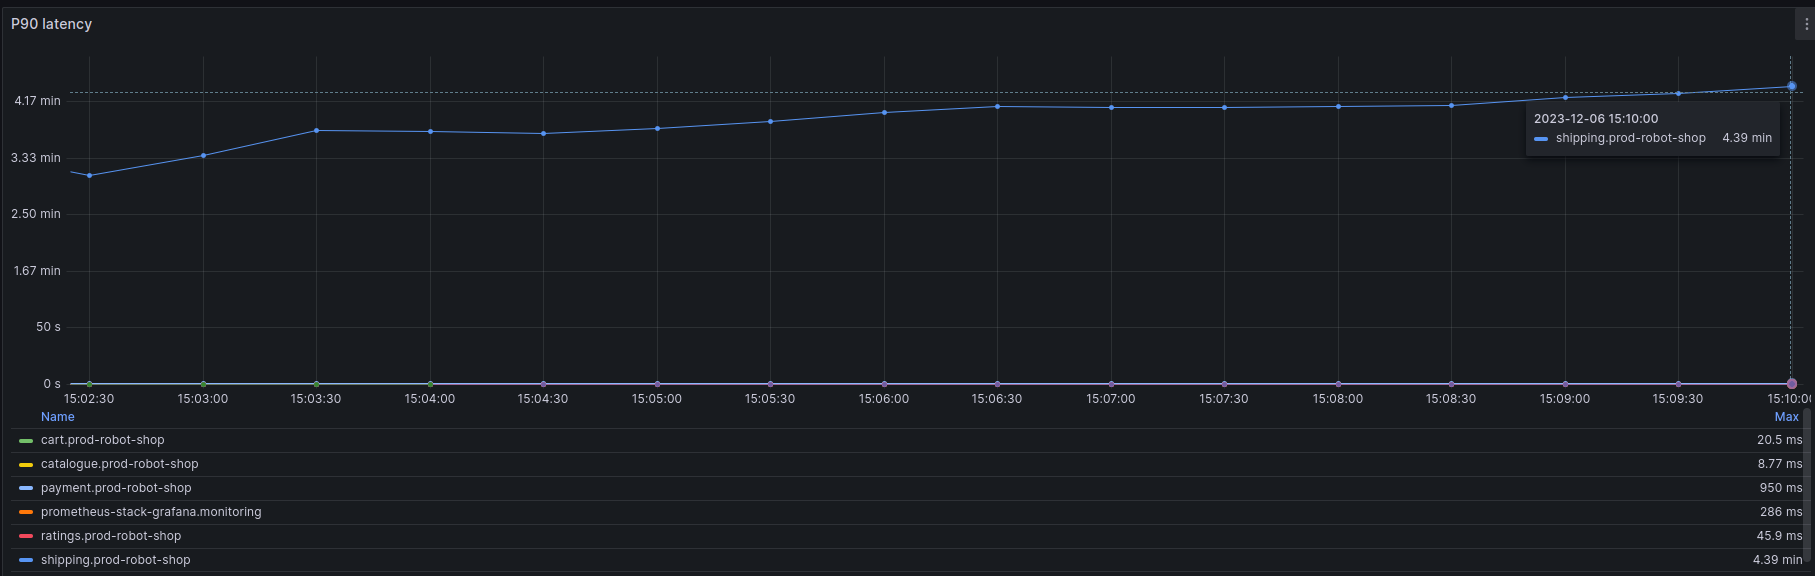
“OK, let’s look at the latency dashboards first.” Robin clicks on the attached Grafana dashboard on the Slack notification for the alert sent by PagerDuty. This opens up the latency graph of the Shipping service.
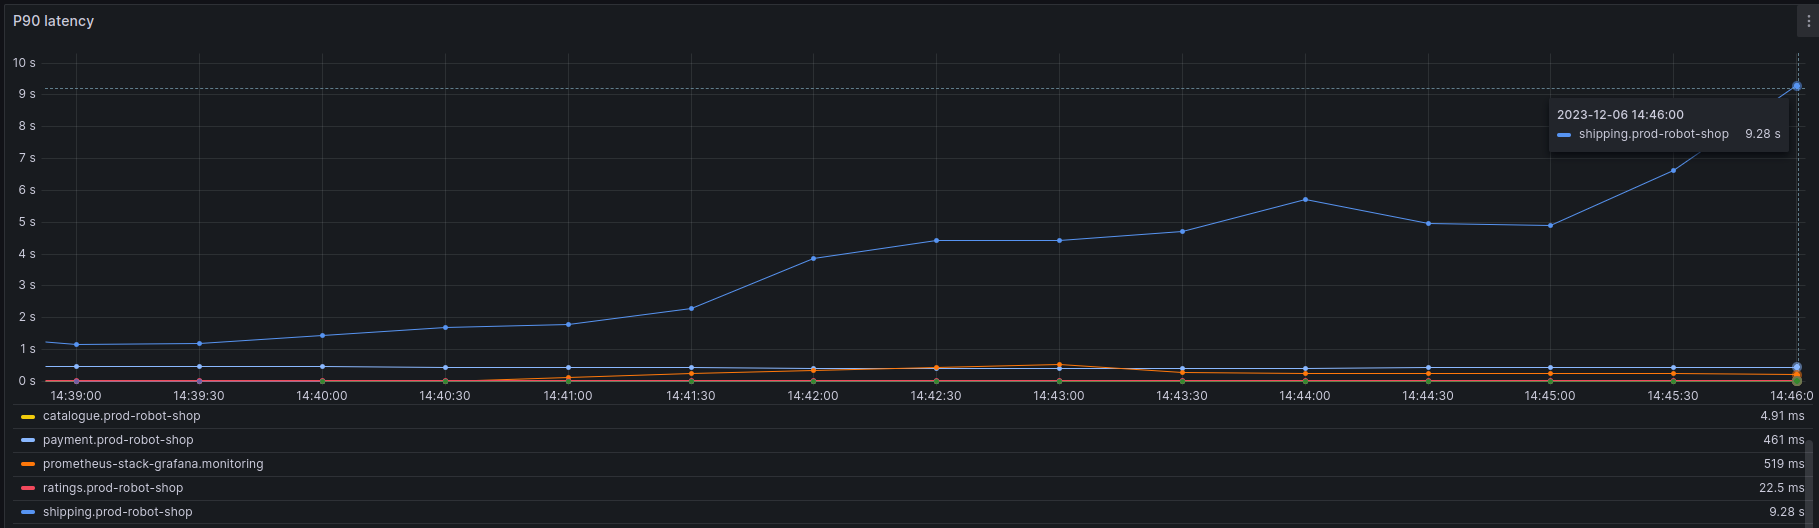
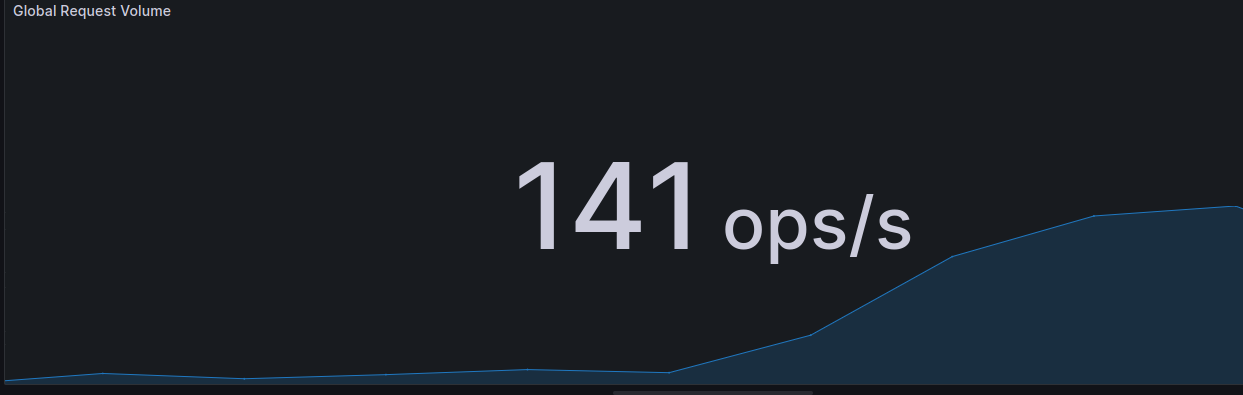
“How did it go from 1s to ~9.28s within 4-5 minutes? Did traffic spike?” Robin decides to focus on the Gateway ops/sec panel of the dashboard. The number is around ~140 ops/sec. Robin knows this data is coming from their Istio gateway and is reliable. The current number is more than affordable for Robot-Shop’s cluster, though there is a steady uptick in the request-count for Robot-Shop.
None of the other services show any signs of wear and tear, only Shipping. Robin understands this is a localized incident and decides to look at the shipping logs. The logs are sourced from Loki, and the widget is conveniently placed right beneath the latency panel, showing logs from all services in the selected time window. Nothing in the logs, and no errors regarding connection timeouts or failed transactions. So far the only thing going wrong is the latency, but no requests are failing yet; they are only getting delayed by a very long time. Robin makes a note: We need to adjust frontend timeouts for these APIs. We should have already gotten a barrage of request timeout errors as an added signal.
Did a developer deploy an unapproved change yesterday? Usually, the support team is informed of any urgent hotfixes before the weekend. Robin decides to check the ArgoCD Dashboards for any changes to shipping or any other services. Nothing there either, no new feature releases in the last 2 days.
Did the infrastructure team make any changes to the underlying Kubernetes cluster? Any version upgrades? The Infrastructure team uses Atlantis to gate and deploy the cluster updates via Terraform modules. The last date of change is from the previous week.
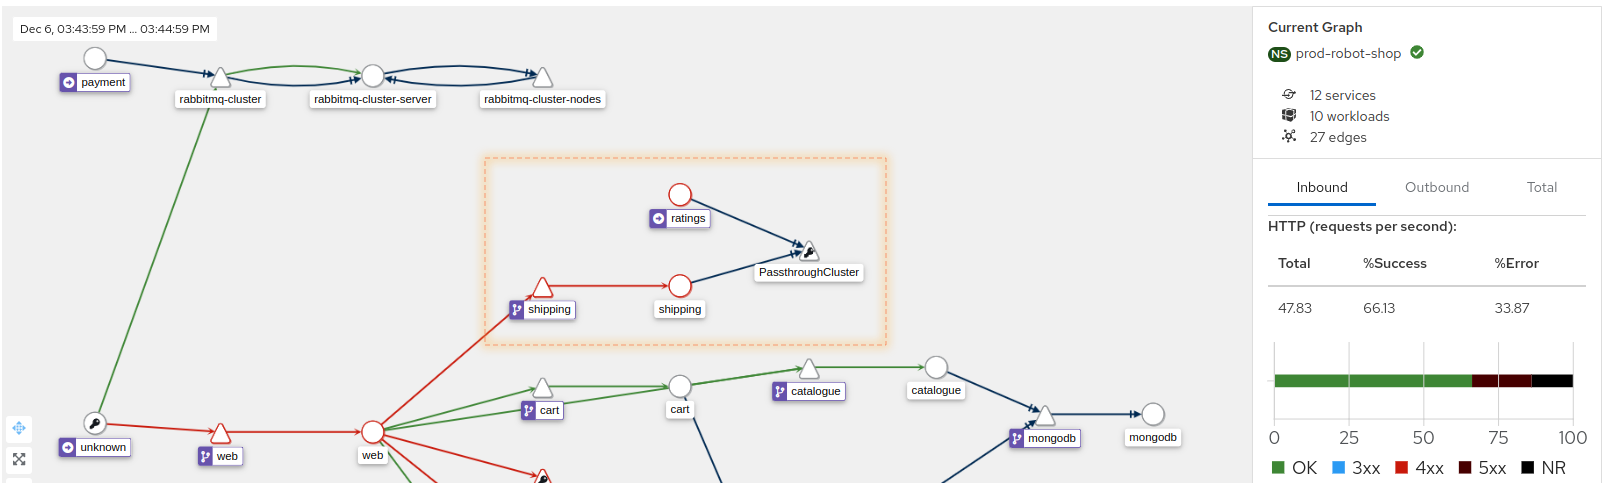
With no errors seen in the logs and partial service degradation as the only signal available to them, Robin cannot make any more headway into this problem. Something else may be responsible, could it be an upstream or downstream service that the shipping service depends on? Is it one of the datastores? Robin pulls up the Kiali service graph that uses Istio’s mesh to display the service topology to look at the dependencies.
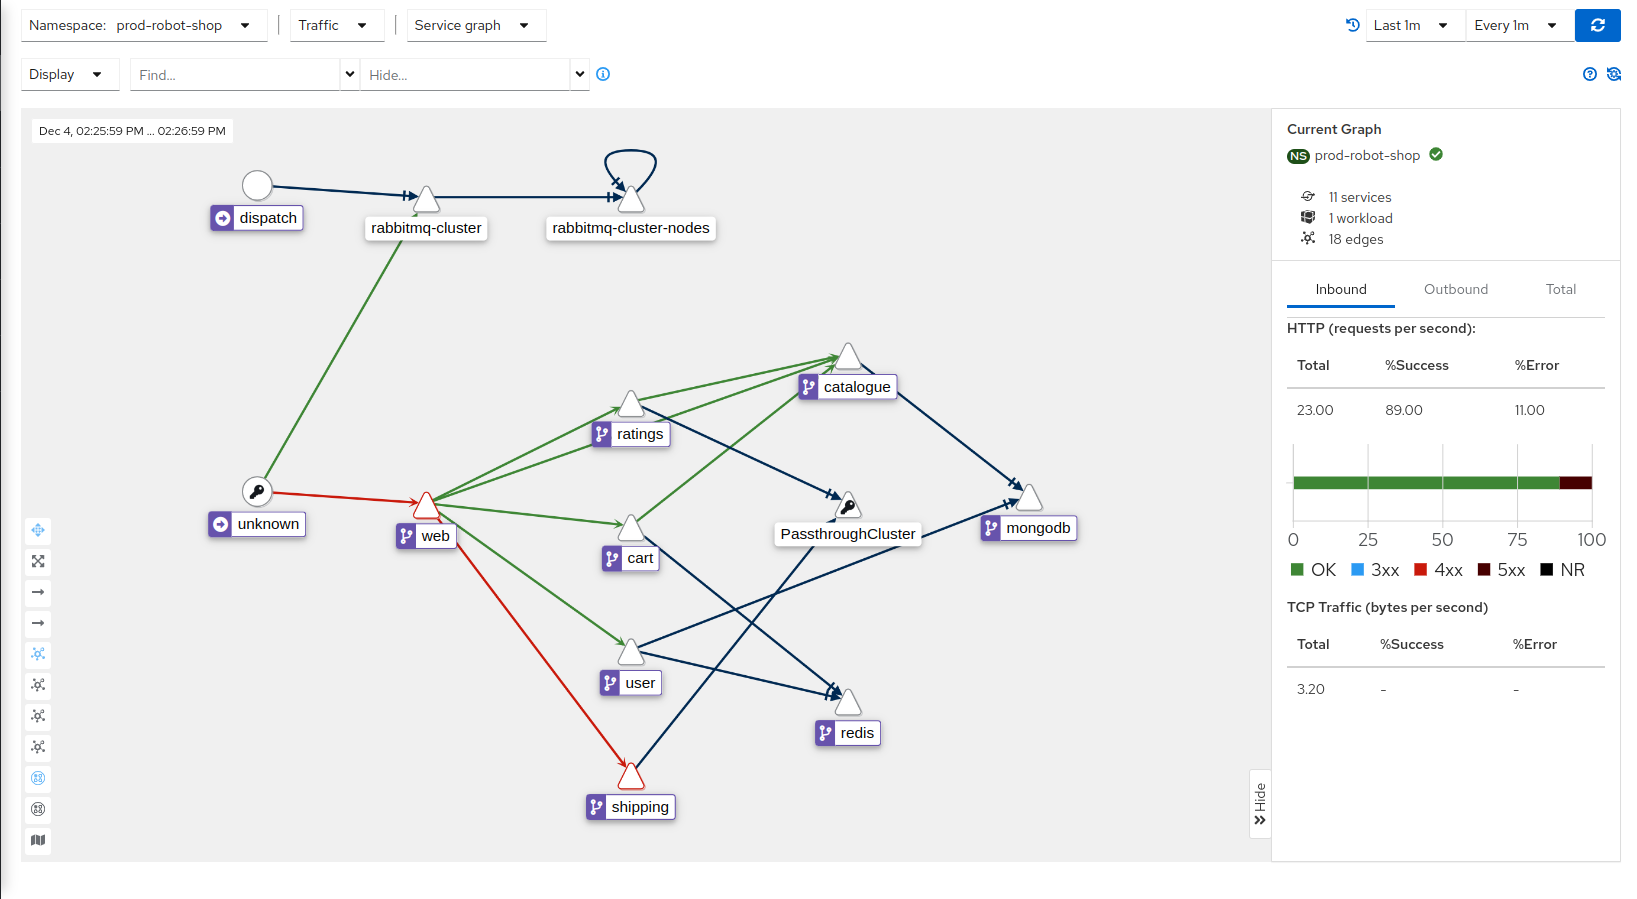
Robin sees that Shipping has now started throwing its first 5xx errors, and both Shipping and Ratings are talking to something labeled as PassthroughCluster. The support team does not maintain any of these platforms and does not have access to the runtimes or the codebase. “I need to get relevant people involved at this point and escalate to folks in my team with higher access levels,” Robin thinks.
Stakeholders assemble
It’s already been 5 minutes since the first report and customers are now getting affected.
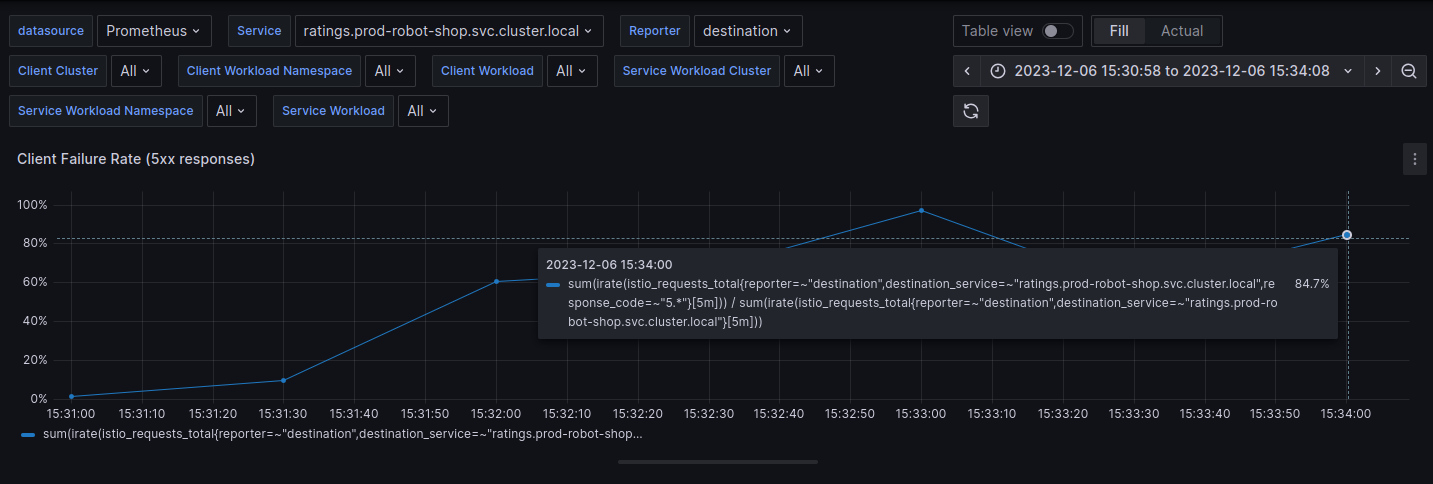
Robin’s team lead Blake joins in on the call, and they also add the backend engineer who owns Shipping service as an SME. The product manager responsible for Shipping has already received the first complaints from the customer support team who has escalated the incident to them; they see the ongoing call on the #live-incidents channel on Slack, and join in. P90 latency alerts are now clogging the production alert channel as the metric has risen to ~4.39 minutes, and 30% of the requests are receiving 5xx responses.
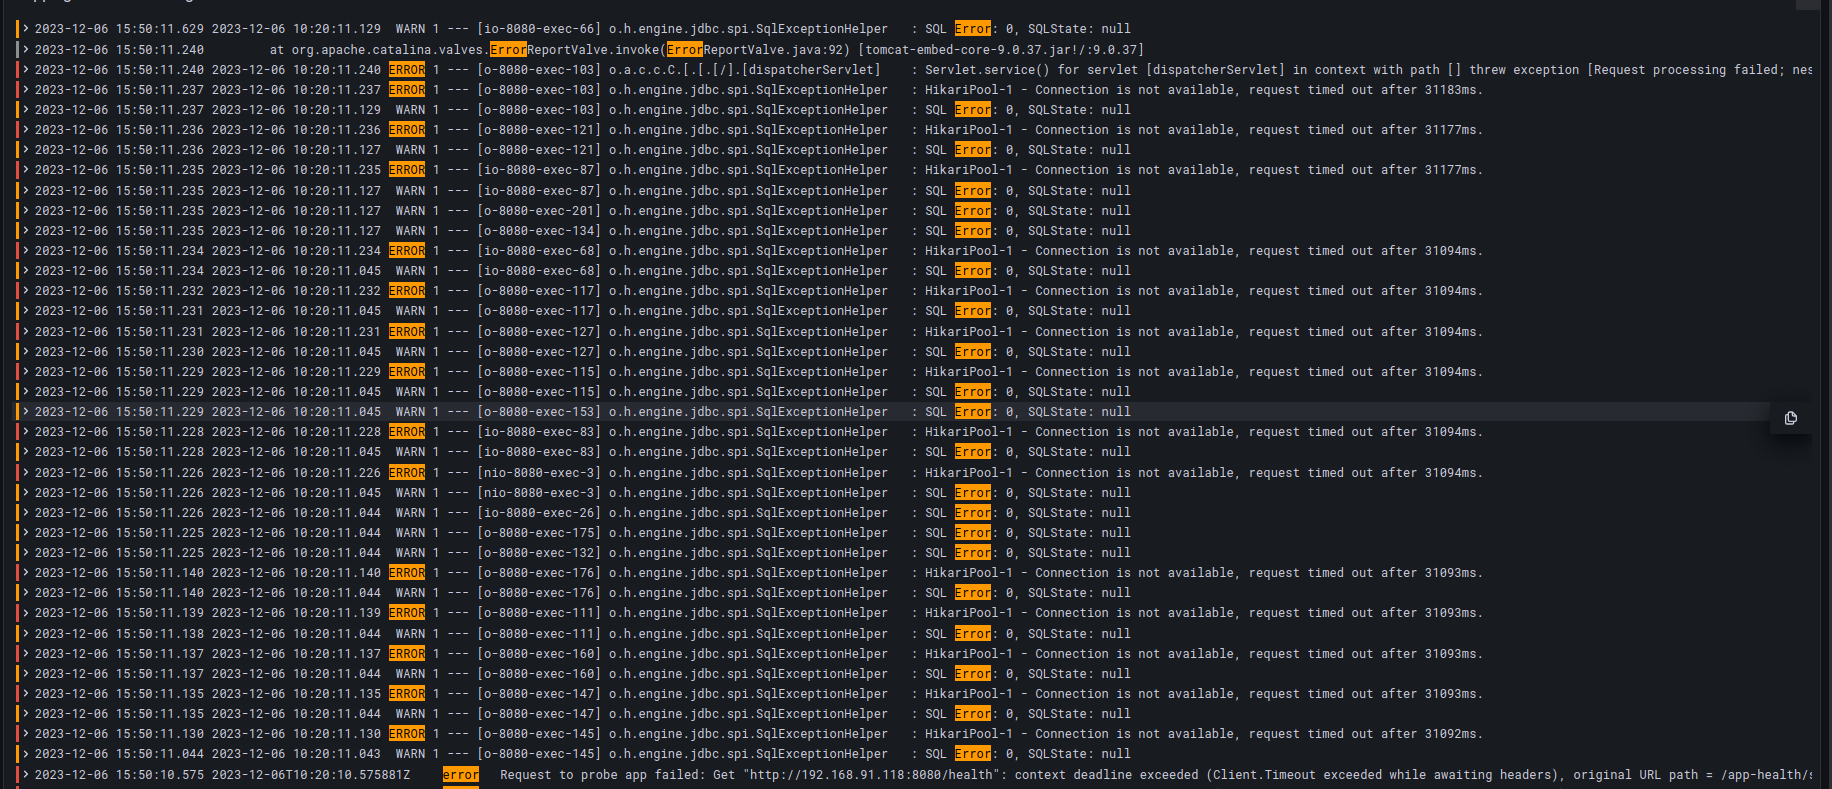
The team now has multiple signals converging on the problem. Blake digs through shipping logs again and sees errors around MySQL connections. At this time, the Ratings service also starts throwing 5xx errors – the problem is now getting compounded.
The Product Manager (PM) says their customer support team is reporting frustration from more and more users who are unable to see the shipping status of the orders they have already paid for and who are supposed to get the deliveries that day. Users who just logged in are unable to see product ratings and are refreshing the pages multiple times to see if the information they want is available.
“If customers can’t make purchase decisions quickly, they’ll go to our competitors,” the PM informs the team.
Blake looks at the PassthroughCluster node on Kiali, and it hits them: It’s the RDS instance. The platform team had forgotten to add RDS as an External Service in their Istio configuration. It was an honest oversight that could cost Robot-Shop significant revenue loss today.
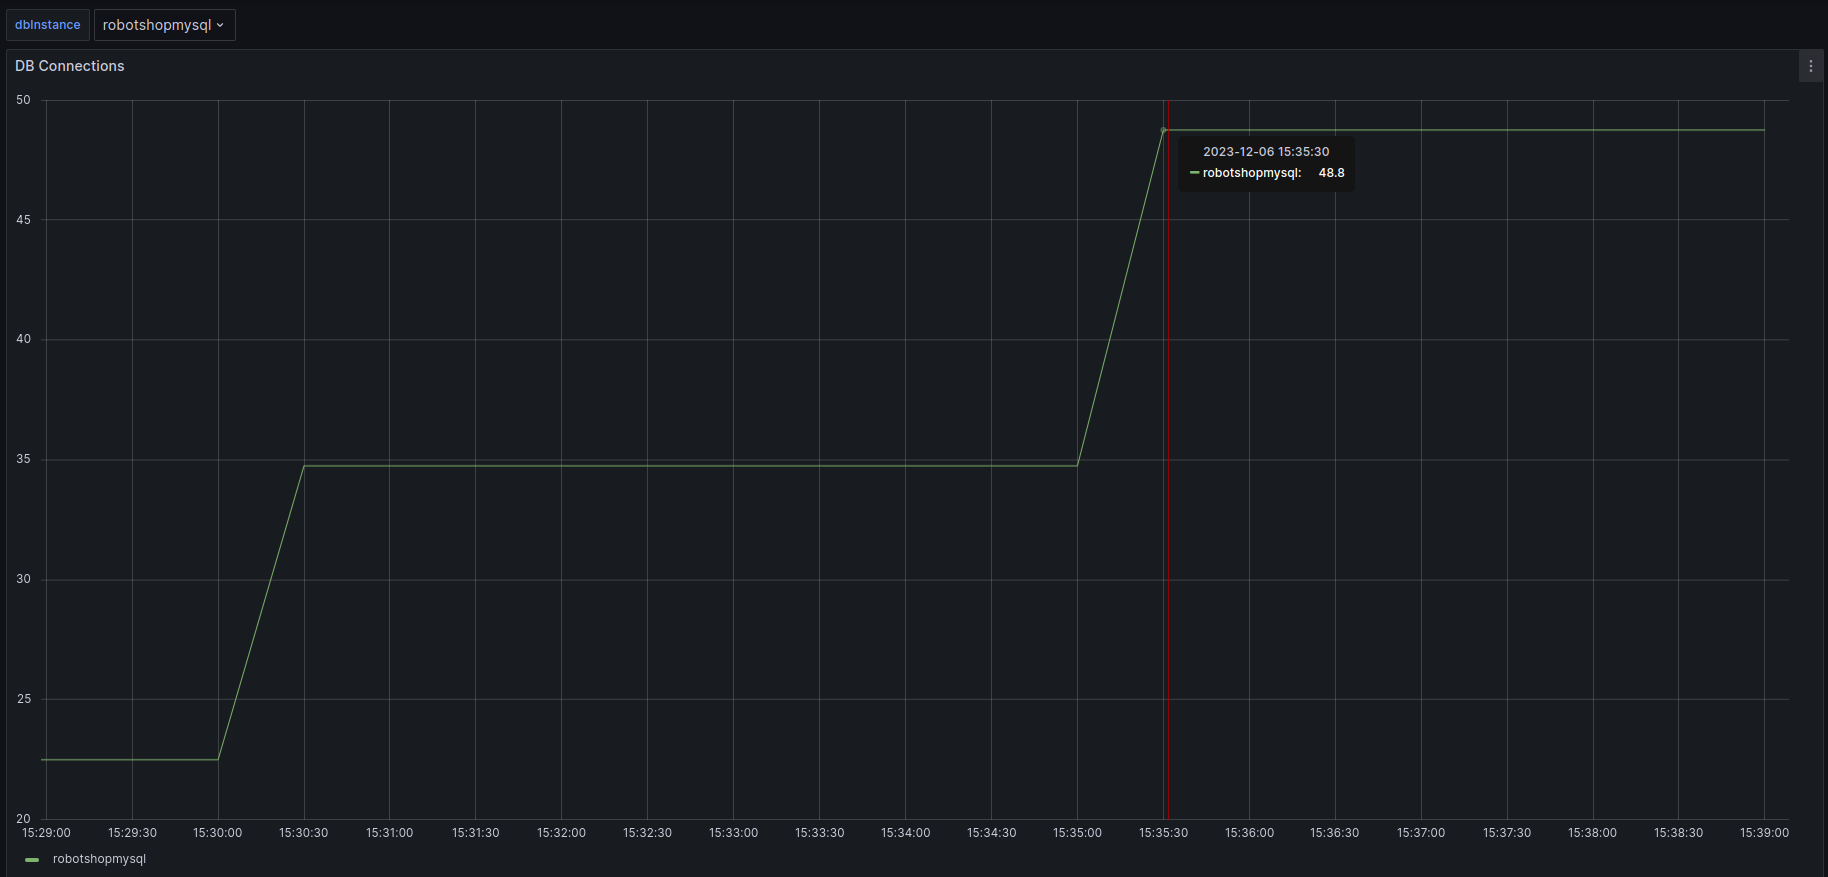
“I think MySQL is unable to handle new connections for some reason,” Blake says. They pull up the MySQL metrics dashboards and look at the number of Database Connections. It has gone up significantly and then flattened. “Why don’t we have an alert threshold here? It seems like we might have maxed out the MySQL connection pool!”
To verify their hypothesis, Blake looks at the Parameter Group for the RDS Instance. It uses the default-mysql-5.7 Parameter group, and max_connections is set to:
{DBInstanceClassMemory/12582880}
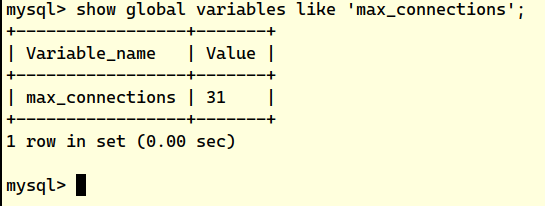
But, what does that number really mean? Blake decides not to waste time with checking the RDS Instance Type and computing the number. Instead, they log into the RDS instance with mysql-cli and run:
#mysql> SHOW VARIABLES LIKE "max_connections";
Then Blake runs:
#mysql> SHOW processlist;
“I need to know exactly how many,” Blake thinks, and runs:
#mysql> SELECT COUNT(host) FROM information_schema.processlist;
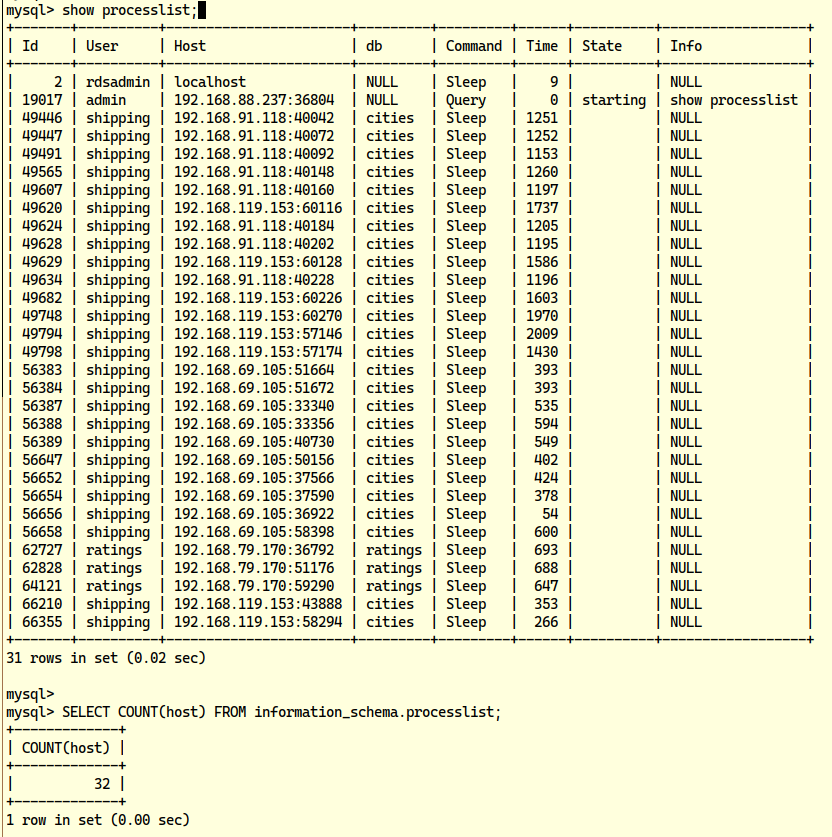
It’s more than the number of max_connections. Their hypothesis is now validated: Blake sees a lot of connections are in sleep() mode for more than ~1000 seconds, and all of these are being created by the shipping user.
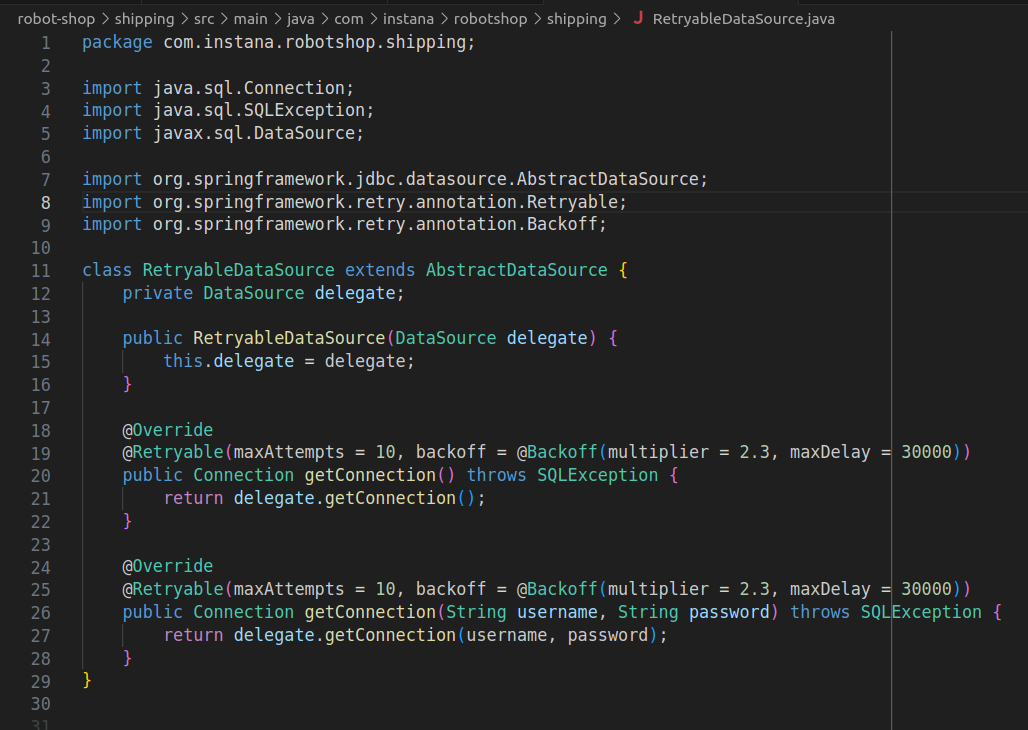
“I think we have it,” Blake says, “Shipping is not properly handling connection timeouts with the DB; it’s not refreshing its unused connection pool.” The backend engineer pulls up the Java JDBC datasource code for shipping and says that it’s using defaults for max-idle, max-wait, and various other Spring datasource configurations. “These need to be fixed,” they say.
“That would need significant time,” the PM responds, “and we need to mitigate this incident ASAP. We cannot have unhappy customers.”
Blake knows that RDS has a stored procedure to kill idle/bad processes.
mysql#> CALL mysql.rds_kill(processID)
Blake tests this out and asks Robin to quickly write a bash script to kill all idle processes.
#!/bin/bash

# MySQL connection details
MYSQL_USER="<user>"
MYSQL_PASSWORD="<passwd>"
MYSQL_HOST="<rds-name>.<id>.<region>.rds.amazonaws.com"

# Get process list IDs
PROCESS_IDS=$(MYSQL_PWD="$MYSQL_PASSWORD" mysql -h "$MYSQL_HOST" -u "$MYSQL_USER" -N -s -e "SELECT ID FROM INFORMATION_SCHEMA.PROCESSLIST WHERE USER='shipping'")

for ID in $PROCESS_IDS; do
    MYSQL_PWD="$MYSQL_PASSWORD" mysql -h "$MYSQL_HOST" -u "$MYSQL_USER" -e "CALL mysql.rds_kill($ID)"
    echo "Terminated connection with ID $ID for user 'shipping'"
done
The team runs this immediately and the connection pool frees up momentarily. Everyone lets out a visible sigh of relief. “But this won’t hold for long, we need a hotfix on DataSource handling in Shipping”, Blake says. The backend engineer informs they are on it and soon they have a patch-up that adds better defaults for
spring.datasource.max-active
spring.datasource.max-age
spring.datasource.max-idle
spring.datasource.max-lifetime
spring.datasource.max-open-prepared-statements
spring.datasource.max-wait
spring.datasource.maximum-pool-size
spring.datasource.min-evictable-idle-time-millis
spring.datasource.min-idle
The team approves the hotfix and deploys it, finally mitigating a ~30 minute long incident.
Key takeaways
Incidents such as this can occur in any organization with sufficiently complex architecture involving microservices written in different languages and frameworks, datastores, queues, caches, and cloud native components. A lack of understanding of end-to-end architecture and information silos only adds to the mitigation timelines.
During this RCA, the team finds out that they have to improve on multiple accounts.
- Frontend code had long timeouts and allowed for large latencies in API responses.
- The L1 Engineer did not have an end-to-end understanding of the whole architecture.
- The service mesh dashboard on Kiali did not show External Services correctly, causing confusion.
- RDS MySQL database metrics dashboards did not send an early alert, as no max_connection (alert) or high_number_of_connections (warning) thresholds were set.
- The database connection code was written with the assumption that sane defaults for connection pool parameters were good enough, which proved incorrect.
Pressure to resolve incidents quickly that often comes from peers, leadership, and members of affected teams only adds to the chaos of incident management, causing more human errors. Coordinating incidents such as this through the process of having an Incident Commander role has shown more controllable outcomes for organizations around the world. An Incident Commander assumes the responsibility of managing resources, planning, and communications during a live incident, effectively reducing conflict and noise.
When multiple stakeholders are affected by an incident, resolutions need to be handled in order of business priority, working on immediate mitigations first, then getting the customer experience back at nominal levels, and only afterward focusing on long-term preventions. Coordinating these priorities across stakeholders is one of the most important functions of an Incident Commander.
Troubleshooting complex architecture remains a challenging activity to date. However, with the Blameless RCA Framework coupled with periodic metric reviews, a team can focus on incremental but constant improvements of their system observability. The team could also convert all successful resolutions to future playbooks that can be used by L1 SREs and support teams, making sure that similar errors can be handled well.
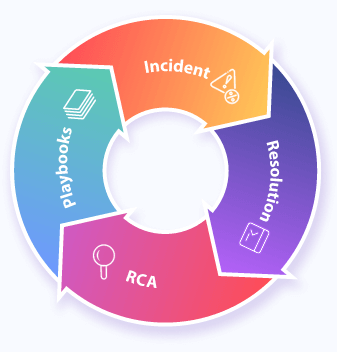
Concerted effort around a clear feedback loop of Incident -> Resolution -> RCA -> Playbook Creation eventually rids the system of most unknown-unknowns, allowing teams to focus on Product Development, instead of spending time on chaotic incident handling.
That’s a wrap
Hope you all enjoyed that story about a hypothetical but complex troubleshooting scenario. We see incidents like this and more across various clients we work with at InfraCloud. The above scenario can be reproduced using our open source repository. We are working on adding more such reproducible production outages and subsequent mitigations to this repository.
We would love to hear from you about your own 3 am incidents. If you have any questions, you can connect with me on Twitter and LinkedIn.
References
- Ending a session or query - Amazon Relational Database Service
- Blameless Root Cause Analyses - The GitLab Handbook
- Configuring a Tomcat Connection Pool in Spring Boot - Baeldung
- Controlling Database Connections: Spring Framework
- Istio / Accessing External Services
- Monitoring Blocked and Passthrough External Service Traffic
- Quotas and constraints for Amazon RDS - Amazon Relational Database Service
- The role of the incident commander - Atlassian
Stay updated with latest in AI and Cloud Native tech
We hate 😖 spam as much as you do! You're in a safe company.
Only delivering solid AI & cloud native content.
Posts You Might Like