Avoiding Kubernetes Cluster Outages with Synthetic Monitoring

What is synthetic monitoring?
Synthetic monitoring consists of pre-defined checks to proactively monitor the critical elements in your infrastructure. These checks simulate the functionality of the elements. We can also simulate the communication between the elements to ensure end-to-end connectivity. Continuous monitoring of these checks also helps to measure overall performance in terms of availability and response times.
We will narrow down the scope of synthetic checks for Kubernetes clusters and the rest of the post will be based on the same.
Synthetic checks can help SREs identify issues, and determine the slow responses and downtime before it affects the actual business. It may help to proactively detect network failures, misconfigurations, loss of end-to-end connectivity, etc., during upgrades, major architectural changes, or any feature releases.
Why synthetic checks are important in Kubernetes?
Kubernetes is a collection of distributed processes running simultaneously. Thus, identifying the failure domains in a Kubernetes cluster can be a troublesome task. A well-described synthetic check can reduce/avoid the possible downtime due to these failure domains by replicating the intended workflow and measuring its performance. Some failure domains can be described as follows:
- Node issues (Docker daemon/Kubelet in a failed state, unallocated IP address due to CNI failures, etc.).
- Pod issues (failed health checks, pods not in running state, etc.)
- Namespace issues (pods not able to schedule in a Namespace)
- DNS resolution issues (CoreDNS lookup failures)
- Network issues (changes in Network policies, etc.)
- And many more …
Tools available for Kubernetes synthetic checks/monitoring
There are multiple tools available for synthetic monitoring, such as AppDynamics, New Relic, Dynatrace, etc.. For this post, let’s focus on the Kubernetes native synthetic checks.
At the time of writing this post, two tools have Kubernetes native synthetic checks namely Kuberhealthy and Grafana Cloud. Kuberhealthy is an operator-based synthetic monitoring tool that uses custom resources called Kuberhealthy checks (khchecks), while Grafana cloud uses agents to gather data from the probes that periodically check the pre-defined endpoints. Kuberhealthy provides a lot more synthetic checks in comparison to Grafana Cloud and also it is an open-source option too. Thus, we will explore synthetic monitoring in the Kubernetes clusters with the help of Kuberhealthy.
What is Kuberhealthy?
Kuberhealthy is an operator for running synthetic checks. Each synthetic check is a test container (a checker pod) created by a custom resource called khcheck/khjob (Kuberhealthy check/Kuberhealthy job). Once the checks are created, Kuberhealthy schedules all the checks at a given interval and within a given timeout. Synthetic checks are defined in the form of khcheck or khjob. Both custom resources are almost same in functionality except that khjob runs one time whereas khcheck runs at regular intervals.
Deployment check [Courtesy: Kuberhealthy]
Kuberhealthy provisions checker pods corresponding to a particular khcheck. The checker pod is destroyed once the purpose is served. The creation/deletion cycle repeats at regular intervals depending upon the duration of runInterval/timeout respectively in a khcheck configuration. The result is then sent to the Kuberhealthy, that in turn sends it to the metrics and status endpoints. For monitoring, we can integrate it with Prometheus, or view it on JSON based status page. This page gives a consolidated status of all the khchecks.
Checks available with Kuberhealthy
There are pre-defined checks available which check for core Kubernetes functions. We can use the checks provided directly by Kuberhealthy or we can also write our own custom checks according to the use case.
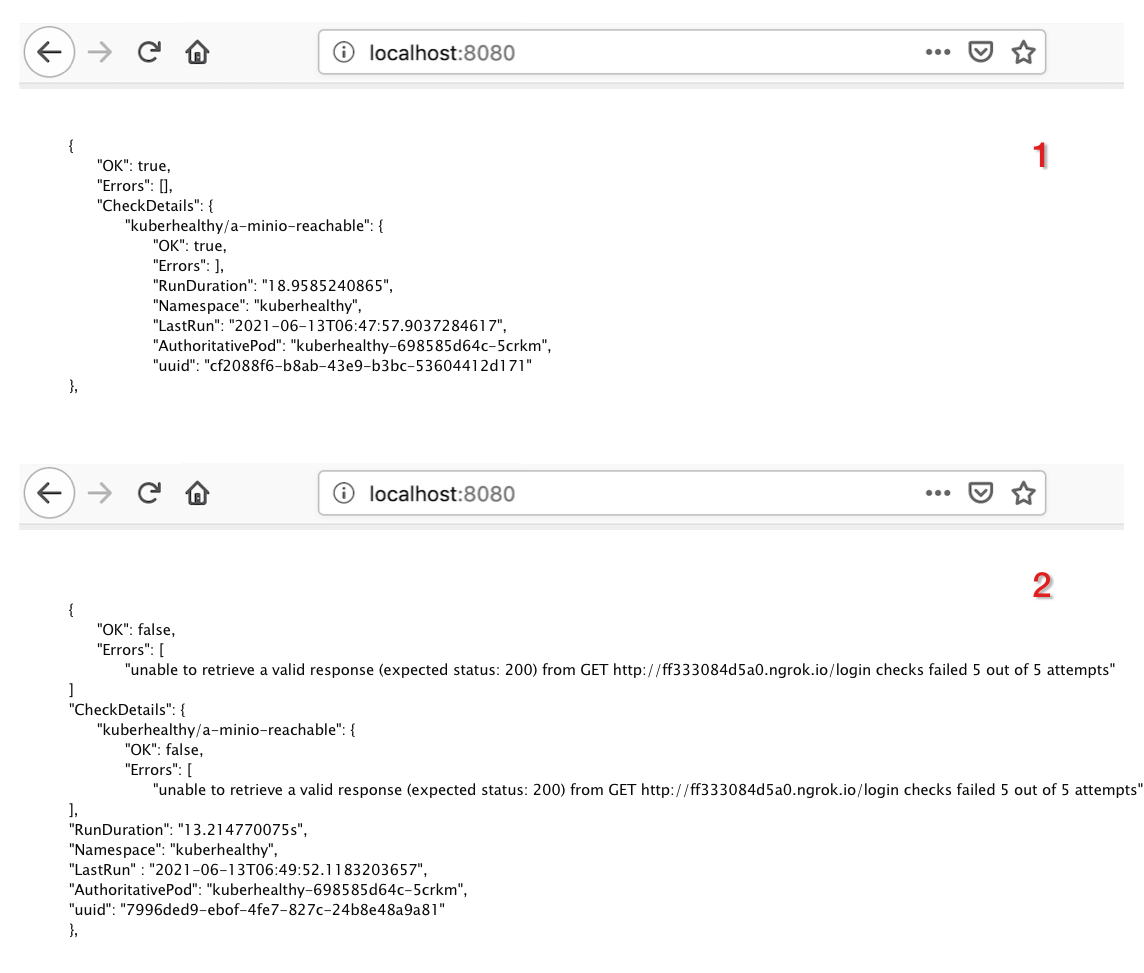
Here is one example of a khcheck. Any application performing CRUD operations on a database/storage needs to have a constant connection with it. Kuberhealthy HTTP check helps to check the connectivity of HTTP/HTTPS endpoints. For example, the following khcheck checks for reachability of MinIO cluster. For simulating the realistic scenario, MinIO is exposed via ngrok. If the connection is successful, it will show OK: true else if the connection breaks, it will show OK: false.
apiVersion: comcast.github.io/v1
kind: KuberhealthyCheck
metadata:
  name: a-minio-reachable
  namespace: kuberhealthy
spec:
  runInterval: 2m
  timeout: 2m
  podSpec:
    containers:
      - name: a-minio-reachable
        image: kuberhealthy/http-check:v1.5.0
        imagePullPolicy: IfNotPresent
        env:
          - name: CHECK_URL
            value: "http://ff333084d5a0.ngrok.io/login"
          - name: COUNT #### default: "0"
            value: "5"
          - name: SECONDS #### default: "0"
            value: "1"
          - name: PASSING_PERCENT #### default: "100"
            value: "100"
          - name: REQUEST_TYPE #### default: "GET"
            value: "GET"
          - name: EXPECTED_STATUS_CODE #### default: "200"
            value: "200"
        resources:
          requests:
            cpu: 15m
            memory: 15Mi
          limits:
            cpu: 25m
    restartPolicy: Always
    terminationGracePeriodSeconds: 5
Some of the important uses are mentioned in the following section.
How we avoided a major outage in a Kubernetes cluster?
We started facing IP address shortages as the Kubernetes cluster deployed in AWS began to grow with a large number of micro-services being onboarded on it. The issue would become more serious during burst scaling or upgrades. The feasible solution was to incorporate the secondary CIDR solution provided by AWS. However, this required a lot of network changes. A small mistake could result in a major outage.
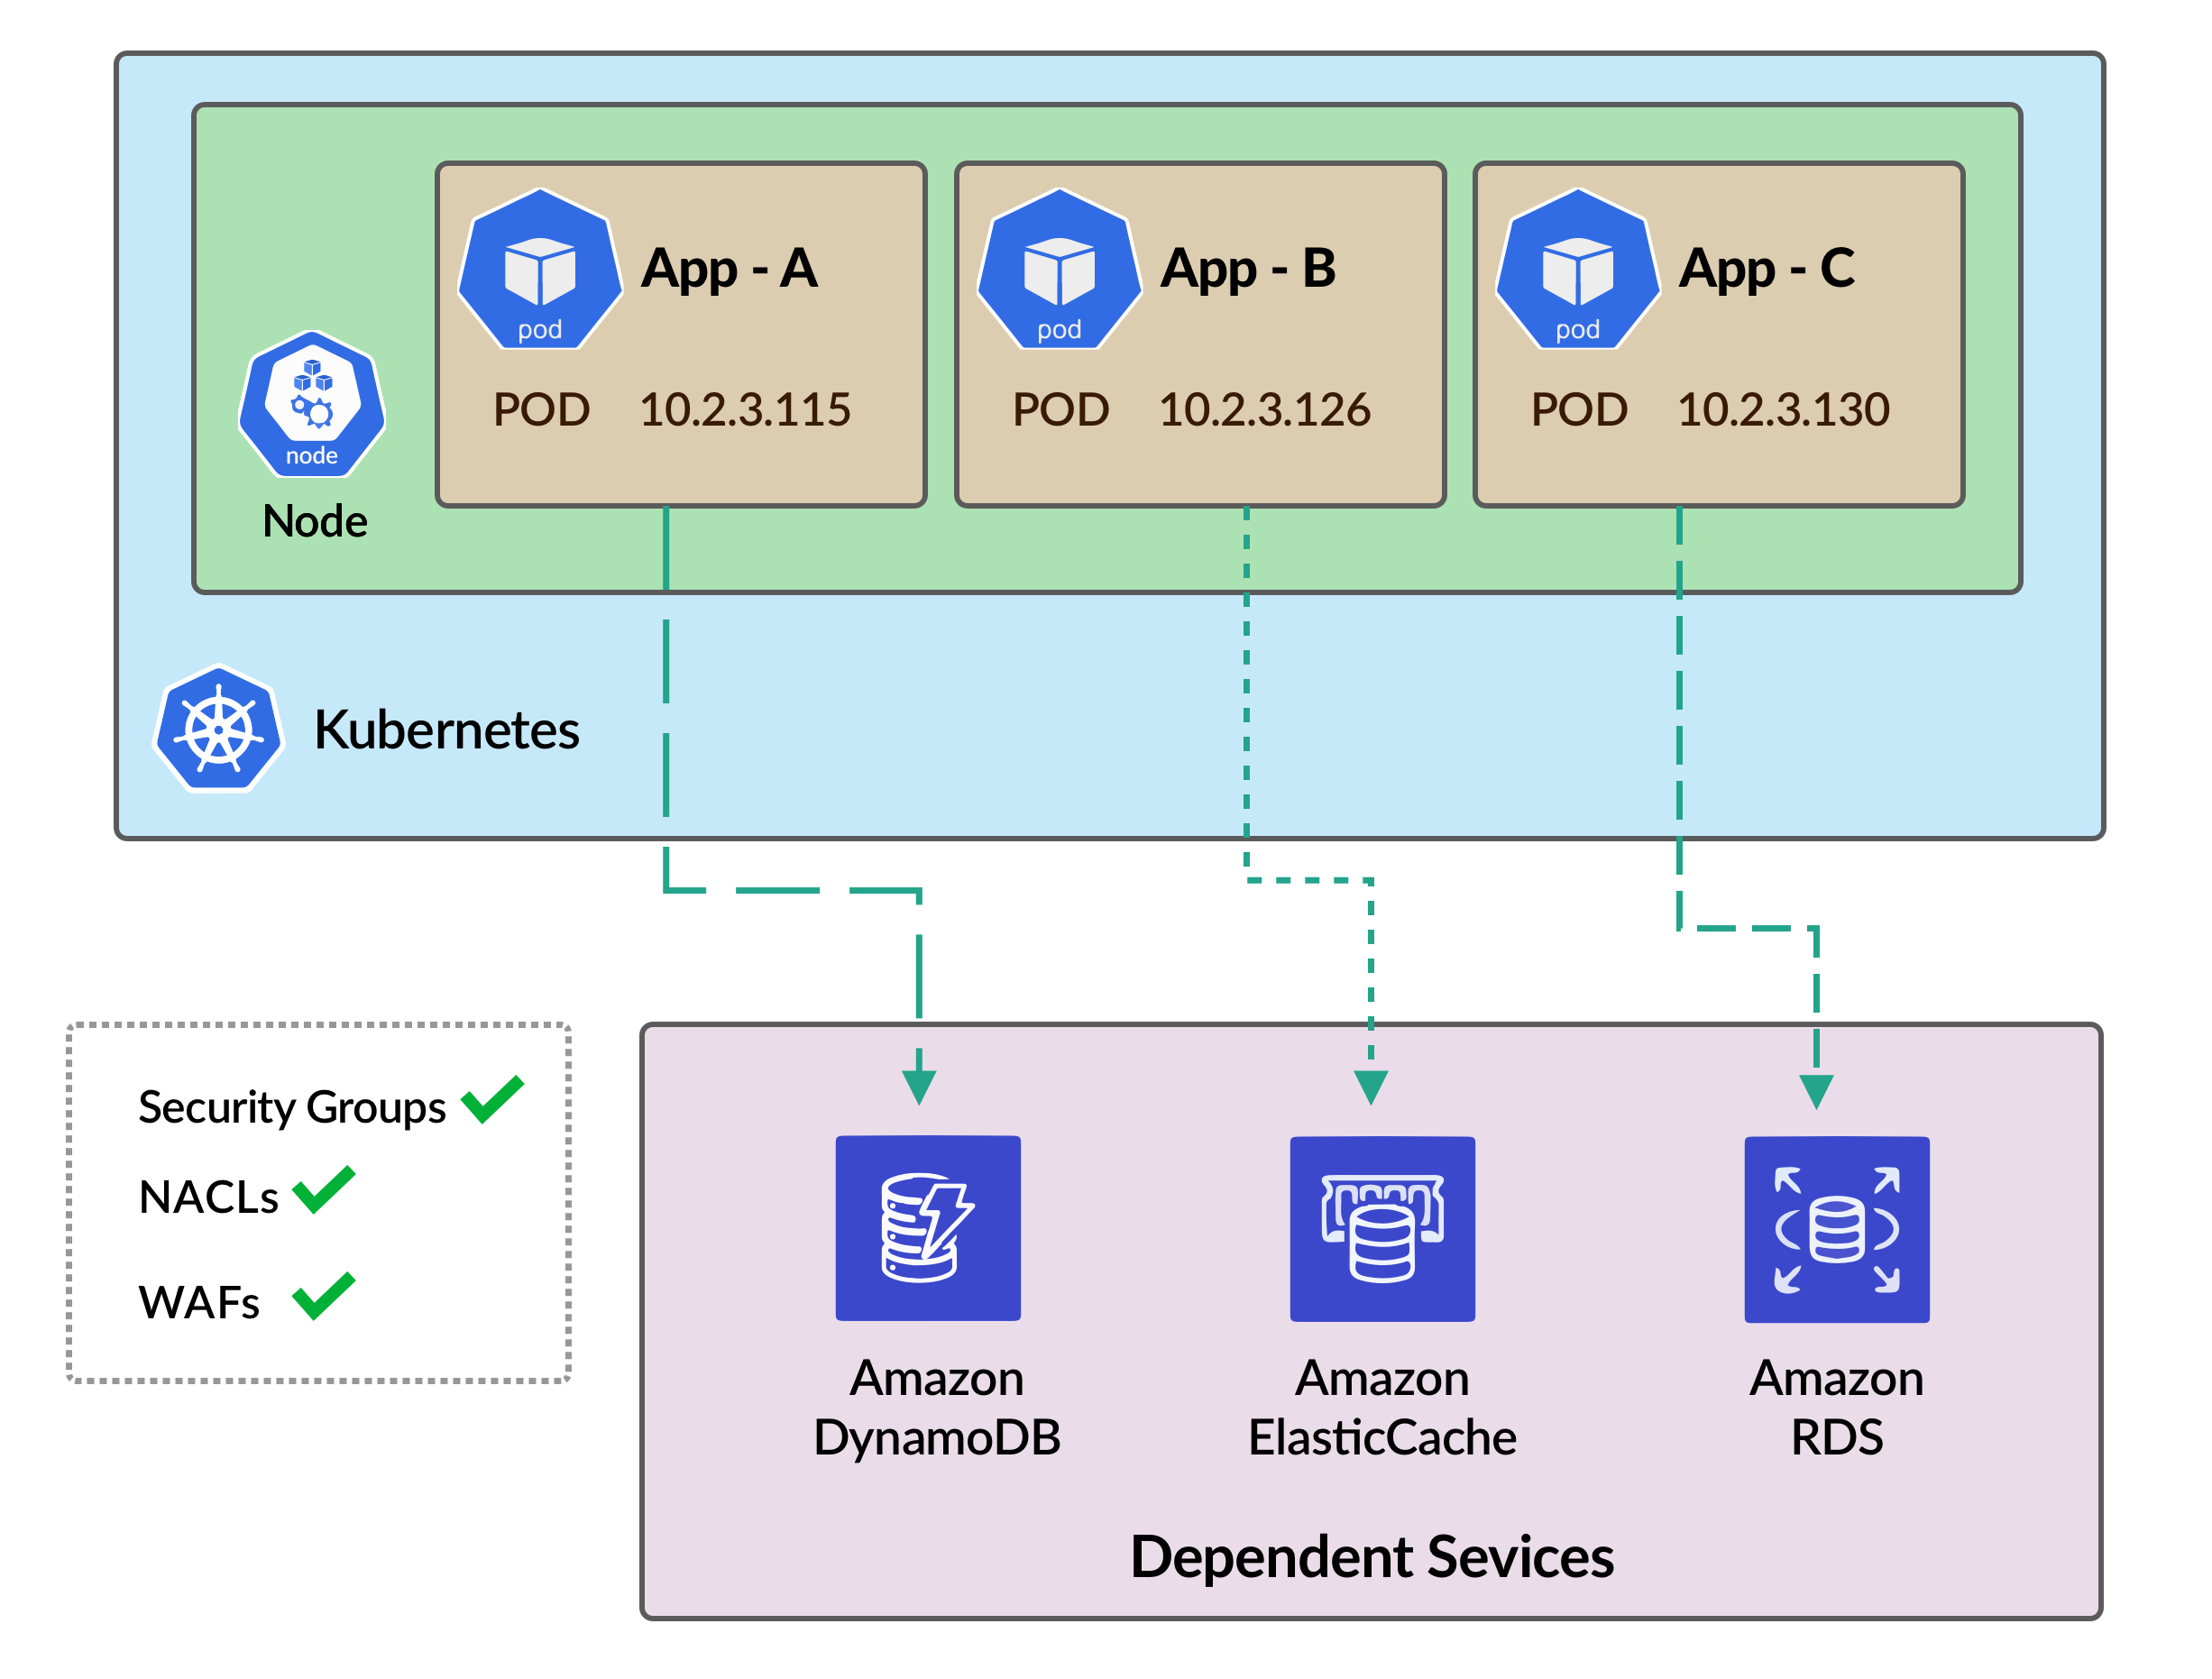
We wanted a solution, that will buy us some time to identify misconfigurations (if any) during the rollout of the solution. We identified all the endpoints of the dependent services for all the micro-services. We created respective TCP and HTTP khchecks and installed Kuberhealthy along with the khcheck manifest. The following image shows the setup before rolling out secondary CIDR. All the pods can connect to the dependent services. (Note that the diagram is a minimalistic version of the scenario.)
Now during the rollout, we wanted to ensure that everything will work fine with the new Pod IP address (100.64.x.x). Thus, we manually added one new node in the cluster which uses the secondary CIDR. khcheck placed a Daemonset on the new node and checked the connectivity with all the endpoints. We realized that some of the endpoints were unable to connect.
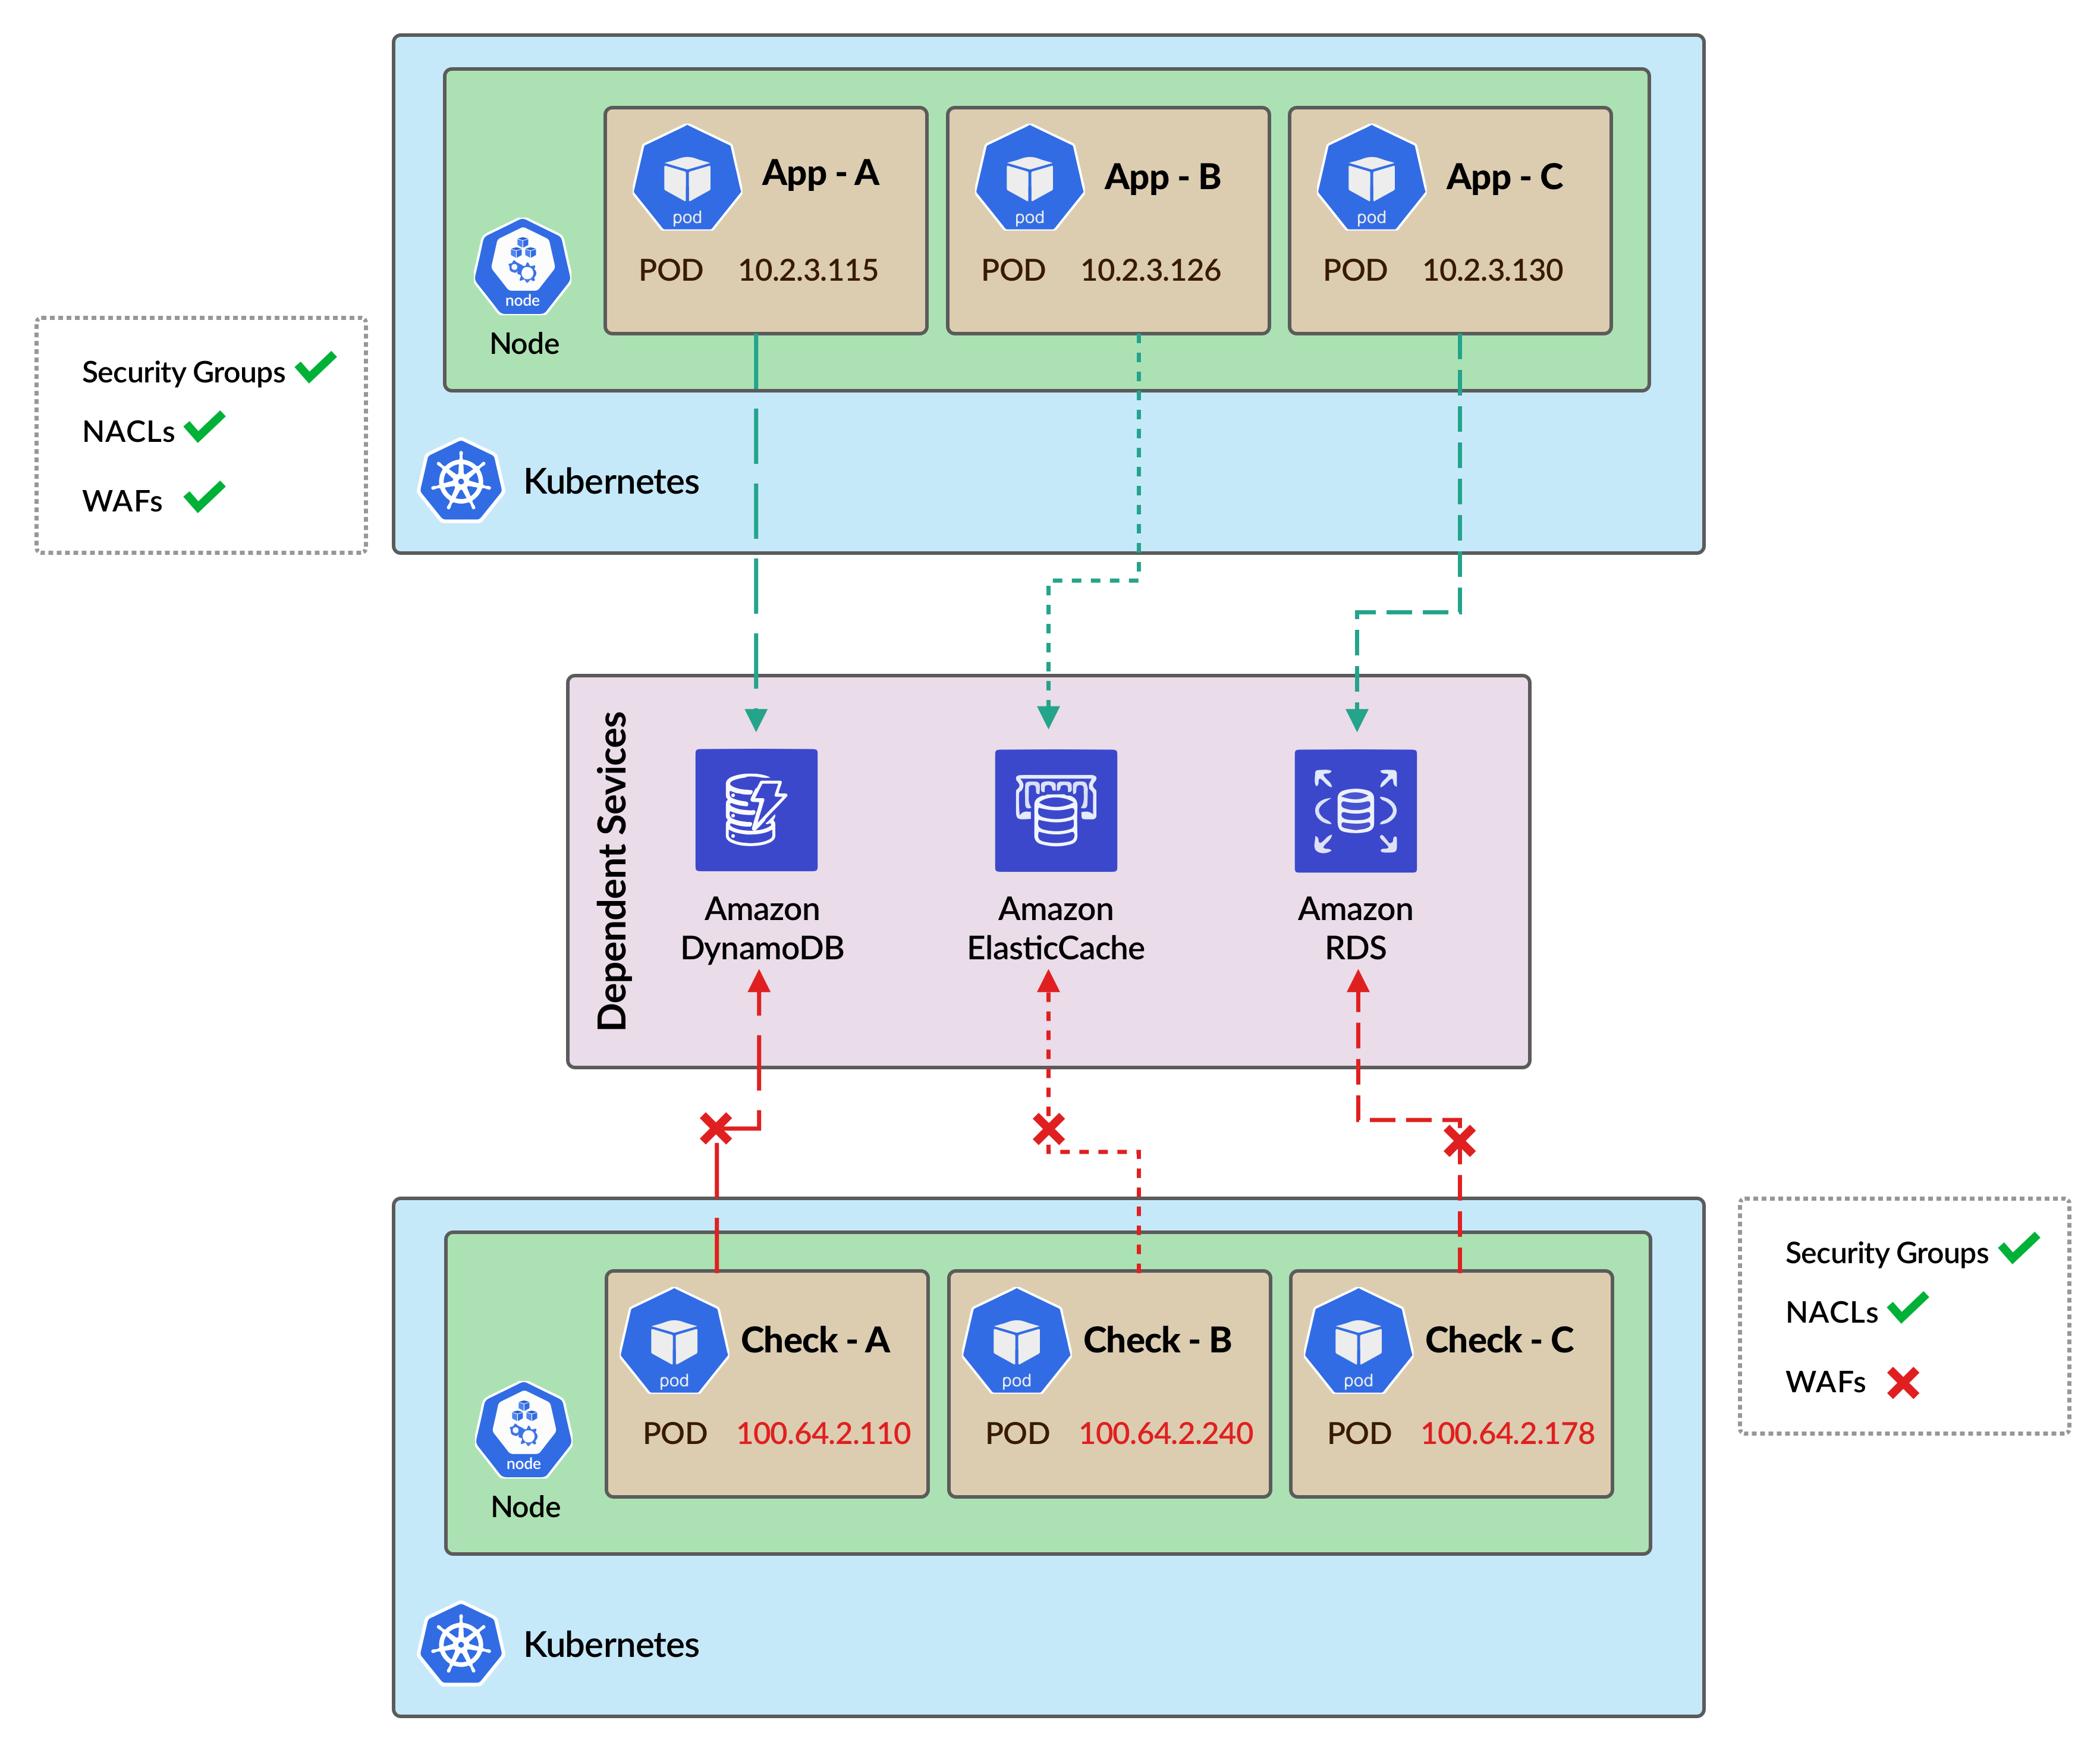
We checked the required whitelisting in Security Groups, NACLs, and WAFs, and found out that the new CIDR is not whitelisted in some of the WAFs. We corrected the WAF configuration accordingly and the khchecks showed status OK. Then we proceed with the actual secondary CIDR rollout and everything worked fine as shown.

This way, we safeguarded our Kubernetes cluster from a major outage with the help of Kuberhealthy.
Use cases for Kuberhealthy synthetic checks
We explored and found out that Kuberhealthy can help in the following use cases to make a Kubernetes cluster more reliable:
Network changes
If there are major network changes you have to carry out, then having some checks on important endpoints using HTTP or TCP khchecks might help to find any misconfigurations and avoid major downtime proactively.
IAM changes
Kuberhealthy has KIAM checks in order to verify proper KIAM functionality. This concept can further be extended to any production-grade cluster that has to be stringent on the workloads’ IAM access. While hardening the access, the security team might block the required access, which may lead to downtime. Having appropriate IAM checks helps minimize downtime (KIAM checks, in case you use KIAM in your cluster).
Additionally, we can also check unnecessary access. We can modify the khchecks to always check for the full access or power user access and alert if anybody provides this access to any workload.
Endpoint connectivity
We can always check whether the important elements outside the cluster such as databases, Key-Value stores are up and running with khchecks monitoring the connectivity with their respective endpoints.
AMI verification
There is a predefined AMI check that verifies the AMI used in the cluster exists in the Amazon marketplace. We can modify the AMI check to verify the important features in a custom-baked AMI like NTP synchronization, directory structures, user access, etc.
CoreDNS checks
An improper CoreDNS configuration may hamper the DNS resolution at heavy loads. Hence, a DNS check can provide the status of DNS resolution both internal and external in such scenarios. To know more on this, follow this guide on how to effectively use CoreDNS with Kubernetes.
Resource Quotas checks
Resource Quotas check is another helpful check which should be running in a production-grade cluster enabled with resource quotas. Suppose the resource quota of a particular namespace is exhausted due to scaling at peak loads. New pods required to serve the additional load won’t be able to be placed in the namespace, which in turn will affect the business in that duration.
These use cases are a few of many that are observed generally. You can have your use cases according to your infrastructure and write your checks for the same.
Conclusion
This article covered the following points:
- What is synthetic monitoring and its importance in production-grade clusters?
- Why synthetic checks are important for Kubernetes cluster?
- What is Kuberhealthy?
- How we safeguarded the Kubernetes cluster from a major outage?
- What are some of the important use cases of synthetic checks with Kuberhealthy?
To sum it up, this post introduced you to Kuberhealthy tool for synthetic monitoring of a Kubernetes cluster in order to avoid outages and increase infrastructure reliability.
Hope this article was helpful to you and in case you have any further queries, please feel free to start a conversation with me on Twitter. Happy Coding :)
Looking for help with Kubernetes adoption or Day 2 operations? do check out how we’re helping startups & enterprises with our managed services for Kubernetes.
References and further reading
- K8s KPIs with Kuberhealthy
- Kuberhealthy: Synthetic Testing for Kubernetes Clusters
- Synthetic Kubernetes cluster monitoring with Kuberhealthy
- Kuberhealthy & the writing the AMI Exists check
- A Trip Down the DNS Rabbit Hole: Understanding the Role of Kubernetes, Golang, libc, systemd
- 12 Synthetic Monitoring Tools for Your Online Business
Stay updated with latest in AI and Cloud Native tech
We hate 😖 spam as much as you do! You're in a safe company.
Only delivering solid AI & cloud native content.
Posts You Might Like