Scaling Prometheus with Cortex (Updated in 2024)

This post was originally written by Shaunak Deshmukh and updated by Akshay Awate in 2024.
Observability has become a crucial aspect of high-performance, HA (high availability) systems. Developers need to have a deep understanding of what is happening in their applications and systems, which is where observability comes in. And one of the cornerstone tools in this domain is Prometheus.
Prometheus has become the default monitoring application and system in a cloud-native world. It has become a go-to tool for collecting, analyzing, and visualizing metrics from different systems. However, when the amount of data increases, the need for a better, scalable solution arises, and that’s where Cortex comes in.
Cortex is a scalable, long-term storage solution that complements Prometheus and provides a better way to handle and query large amounts of monitoring data. Together, Cortex and Prometheus help organizations observe their applications and systems and eventually build high-performing, highly scalable applications.
In this blog post, we will understand what Cortex is and explore its architecture and functionalities. Then, we’ll dive into configuring Cortex with Prometheus to simulate a high-availability monitoring setup.
What is Cortex?
Cortex is a CNCF incubating project that offers long-term storage and a global metrics view for metrics collected using Prometheus. Cortex adds horizontal scalability, high availability, multi-tenancy, and long-term storage to Prometheus.
Let’s look at the primary goals of Cortex first and then some of the problems it solves for Prometheus:
-
Horizontal scalability – Cortex can be split into multiple microservices, each capable of independent horizontal scaling. For example, if multiple Prometheus instances transfer data to Cortex, you can scale up the Ingester microservice. Similarly, you can scale up the Querier or Query Frontend microservices if there are many queries to Cortex.
-
High availability – Cortex can replicate data between instances. This prevents data loss and gaps in metric data even with machine failures and/or pod evictions.
-
Multi-tenancy – A cluster can be shared by multiple untrusted parties. Cortex provides data isolation at every step, from ingestion to querying.
-
Long term storage – Cortex stores data in chunks and generates an index for them. It can be configured to store in self-hosted or cloud provider backed databases or object storage.
Why do we need Cortex?
Making Prometheus high availability for monitoring & avoiding data de-duplication
Prometheus doesn’t have high availability by default. A way to make Prometheus highly available is to run multiple instances scraping the same jobs. These instances will have slight variances in data because of the minor time interval differences when the metrics were scraped. Furthermore, if one of the instances goes down for a couple of hours, there will be gaps in data when queries get forwarded to that instance. If we use a tool like Grafana to visualize the metrics as graphs, we may get different sample values or have gaps in the graphs.
Cortex can be set up to read data from multiple HA Prometheus instances. It accepts metrics from one primary instance and discards them from other instances. If one replica goes down, Cortex can seamlessly switch to another replica and mark it as the primary. To do this, Cortex looks at two labels, a common one to associate with a cluster (or a group of Prometheus) and the other to identify replicas.
Global metrics view
Prometheus instances can be configured to perform a remote write to Cortex. Using this, metrics from multiple clusters can be aggregated into one cluster running Cortex. This provides a central location where we can observe the metrics of our entire infrastructure. Cortex provides a Prometheus/PromQL compatible endpoint. Services like Grafana can add this endpoint as a Prometheus data source and perform queries in the same way as a standard Prometheus instance.
Long-term storage
Prometheus’ local storage is not built for durable long-term storage. So, with Cortex, we can configure a storage device to send and save all the metrics. Cortex stores data in chunks and generates an index for them. Cortex can be set up to keep this information in either self-hosted or cloud provider-backed databases or object storage.
Index (and Chunk) Storage:
- Amazon Dynamodb
- Google Bigtable
- Apache Cassandra
Optionally, Cortex also supports Object Stores for storing chunks:
- Google Cloud Services (GCS)
- Amazon S3
Multi-tenancy
Multiple untrusted parties can share the same cluster. Data can be isolated through Cortex at every step of the lifecycle, from ingestion to querying. This is useful for a large organization when it comes to storing data for multiple units or applications or for someone running a SaaS. The multi-tenancy is provided by setting an HTTP header (X-Scope-OrgID) when writing metrics to the Cortex. The same header value has to be provided when querying.
High availability
You can replicate data between instances with the help of Cortex. So, even if there is a machine failure and/or pod evictions, it will not create any gaps in the metric data. Your data will be safe, at least in one of the pods.
Cortex architecture
Here is an image of Cortex architecture explaining all its components.
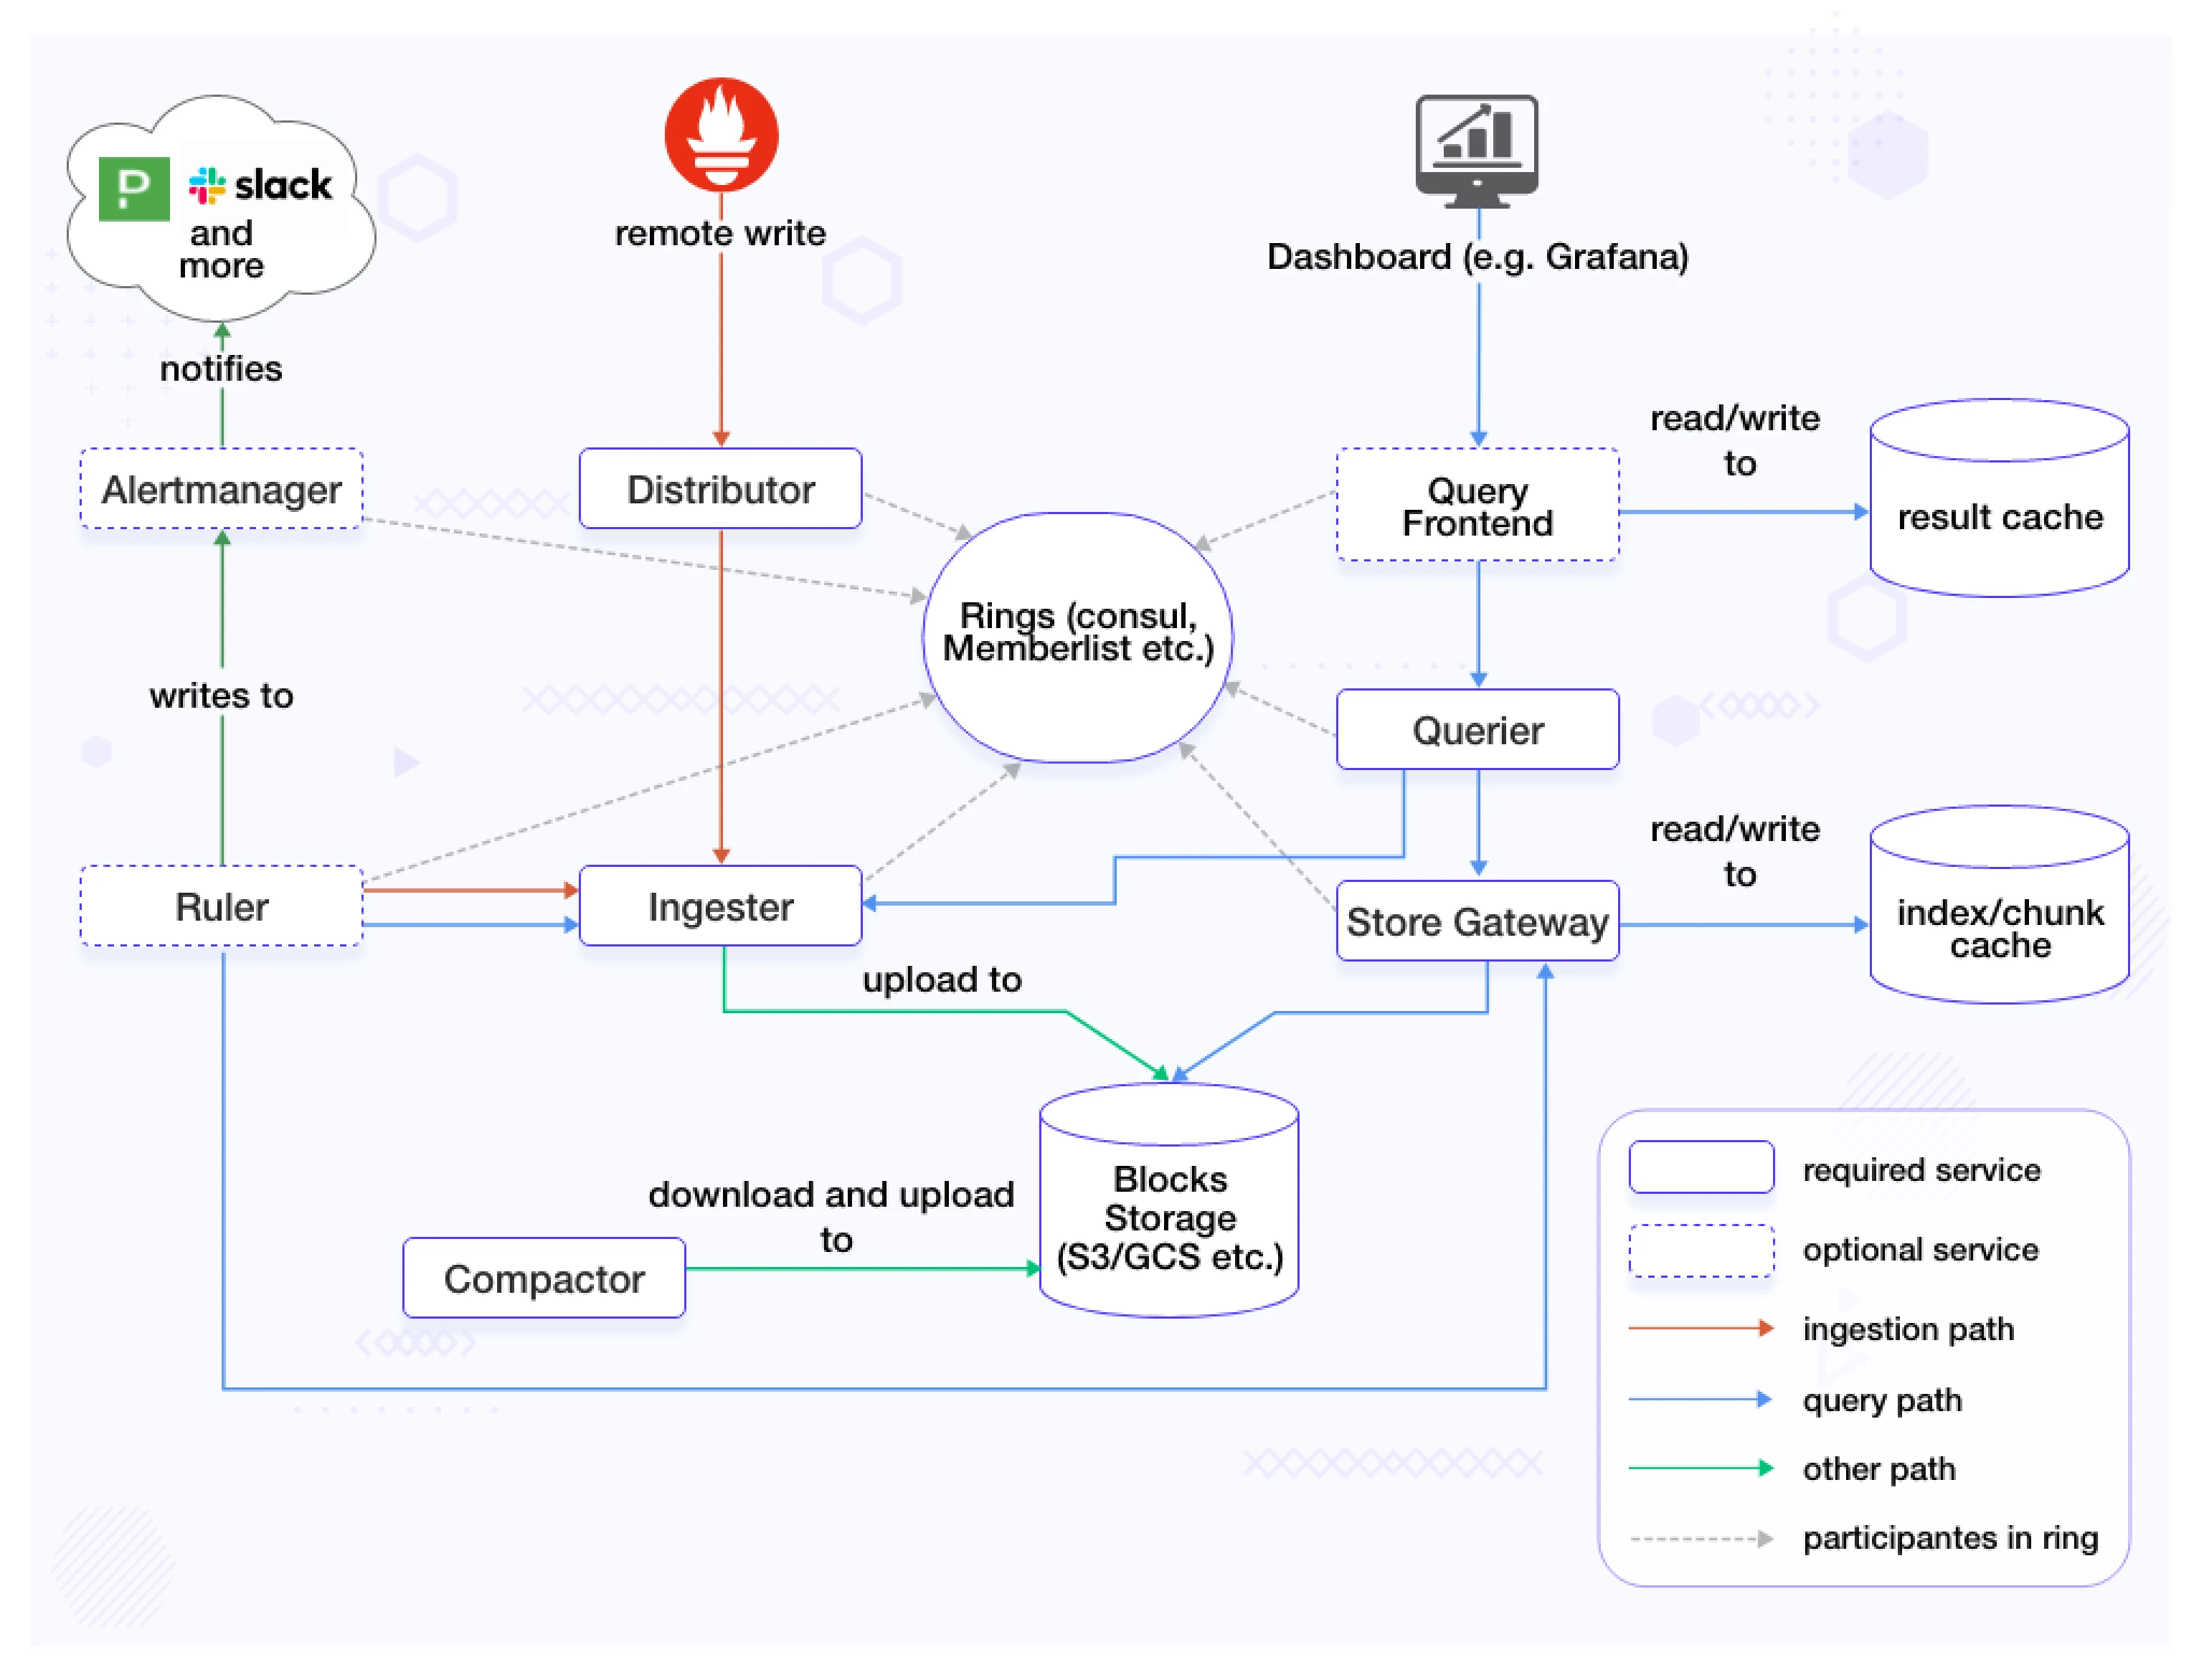
(Image source: Cortex documentation)
Cortex components
Let’s have a look at important Cortex components:
-
Nginx/gateway – A reverse proxy that sits in front of Cortex, forwarding incoming requests to their respective services.
-
Distributor – The distributor service handles the incoming samples from Prometheus. It’s the first step in the write path for series samples. Upon receiving samples from Prometheus, the distributor validates their accuracy and checks if they adhere to the configured tenant limits, falling back to default ones if the limits have not been overridden for the particular tenant.
The validation done by the distributor include:
- The metric labels’ names are formally correct
- The configured maximum number of labels per metric is respected
- The configured max length of a label name and value is respected
-
Ingester – The ingester service writes incoming series to a long-term storage backend on the write path. It also returns in-memory series samples for queries on the read path. Incoming series are not immediately written to the storage but kept in memory and periodically flushed to the storage (by default, 2 hours).
- Compactor – The compactor is a service that is responsible to:
- Compact multiple blocks of a tenant into a single optimized larger block. This helps to reduce the storage costs (index size reduction, deduplication) and improve query speed (it is fast to query fewer blocks).
- Keep the per-tenant bucket index updated. The queriers, store-gateways, and rulers use bucket index to discover new blocks in the storage.
- Store gateway – The store gateway is responsible to query series from blocks. It needs an almost up-to-date view over the storage bucket to discover blocks belonging to their shard. The store-gateway can keep the bucket view updated in two different ways:
- Periodically scanning the bucket (default).
- Periodically downloading the bucket index.
For optional components, you can look at Cortex documentation.
Let’s see Cortex in action
First, we will create two kind clusters, and deploy the Cortex instance and Prometheus instances on both clusters, and configure Cortex to store metrics in S3.
$ helm repo add prometheus-community https://prometheus-community.github.io/helm-charts
$ helm repo update
Let’s create two kind clusters named tenant-one and tenant-two.
$ kind create cluster --name tenant-one
$ kind create cluster --name tenant-two
Follow the LoadBalancer guide from kind documentation to enable LoadBalancer service using MetalLB.
Deploy Cortex only in tenant-one. In this deployment, we will configure Cortex to store metrics in a S3 bucket. Set the values of bucket_name, access_key_id and secret_access_key to appropriate values for your bucket.
#cortex-values.yaml
config:
  blocks_storage:
    backend: s3
    s3:
      bucket_name: cortexs-tenants-metrics
      endpoint: s3.us-east-1.amazonaws.com
      region: us-east-1
      access_key_id: ""
      secret_access_key: ""
    tsdb:
      dir: /data/tsdb
    bucket_store:
      # sync_dir: /data/tsdb-sync
      sync_dir: /data/tsdb
      bucket_index:
        enabled: true
  ruler_storage:
    # backend: s3
    s3:
      bucket_name: cortexs-tenants-metrics
      endpoint: s3.us-east-1.amazonaws.com
      region: us-east-1
      access_key_id: ""
      secret_access_key: ""
  alertmanager_storage:
    # backend: s3
    s3:
      bucket_name: cortexs-tenants-metrics
      endpoint: s3.us-east-1.amazonaws.com
      region: us-east-1
      access_key_id: ""
      secret_access_key: ""
nginx:
  service:
    type: LoadBalancer
$ helm repo add cortex-helm https://cortexproject.github.io/cortex-helm-chart
$ helm install cortex cortex-helm/cortex -f cortex-values.yaml
In Cortex, we have nginx service of type LoadBalancer, which acts as proxy to receive metrics.
$ kubectl get svc
You can see cortex-nginx service, and it has LoadBalancer address.
NAME           TYPE           CLUSTER-IP     EXTERNAL-IP      PORT(S)        AGE
cortex-nginx   LoadBalancer   10.96.16.196   172.18.255.200   80:30295/TCP   1h
Let’s deploy kube-prometheus-stack on both clusters. In the following remote write config, 172.18.255.200 is the cortex-nginx service IP. So, both Prometheus instances will use this load balancer and send metrics to Cortex.
# kube-prometheus-stack-values-tenant-one.yaml
prometheus:
  prometheusSpec:
    remoteWrite:
      - url: http://172.18.255.200:80/api/v1/push
        headers:
          X-Scope-OrgID: tenant-one
    externalLabels:
      __tenant_id__ : tenant-one
$ helm install kube-prometheus-stack \
    prometheus-community/kube-prometheus-stack \
    -f kube-prometheus-stack-values-tenant-one.yaml
And on the tenant-two cluster, run the following:
# kube-prometheus-stack-values-tenant-two.yaml
prometheus:
  prometheusSpec:
    remoteWrite:
      - url: http://172.18.255.200:80/api/v1/push
        headers:
          X-Scope-OrgID: tenant-two
    externalLabels:
      __tenant_id__ : tenant-two
helm install kube-prometheus-stack \
    prometheus-community/kube-prometheus-stack \
    -f kube-prometheus-stack-values-tenant-two.yaml
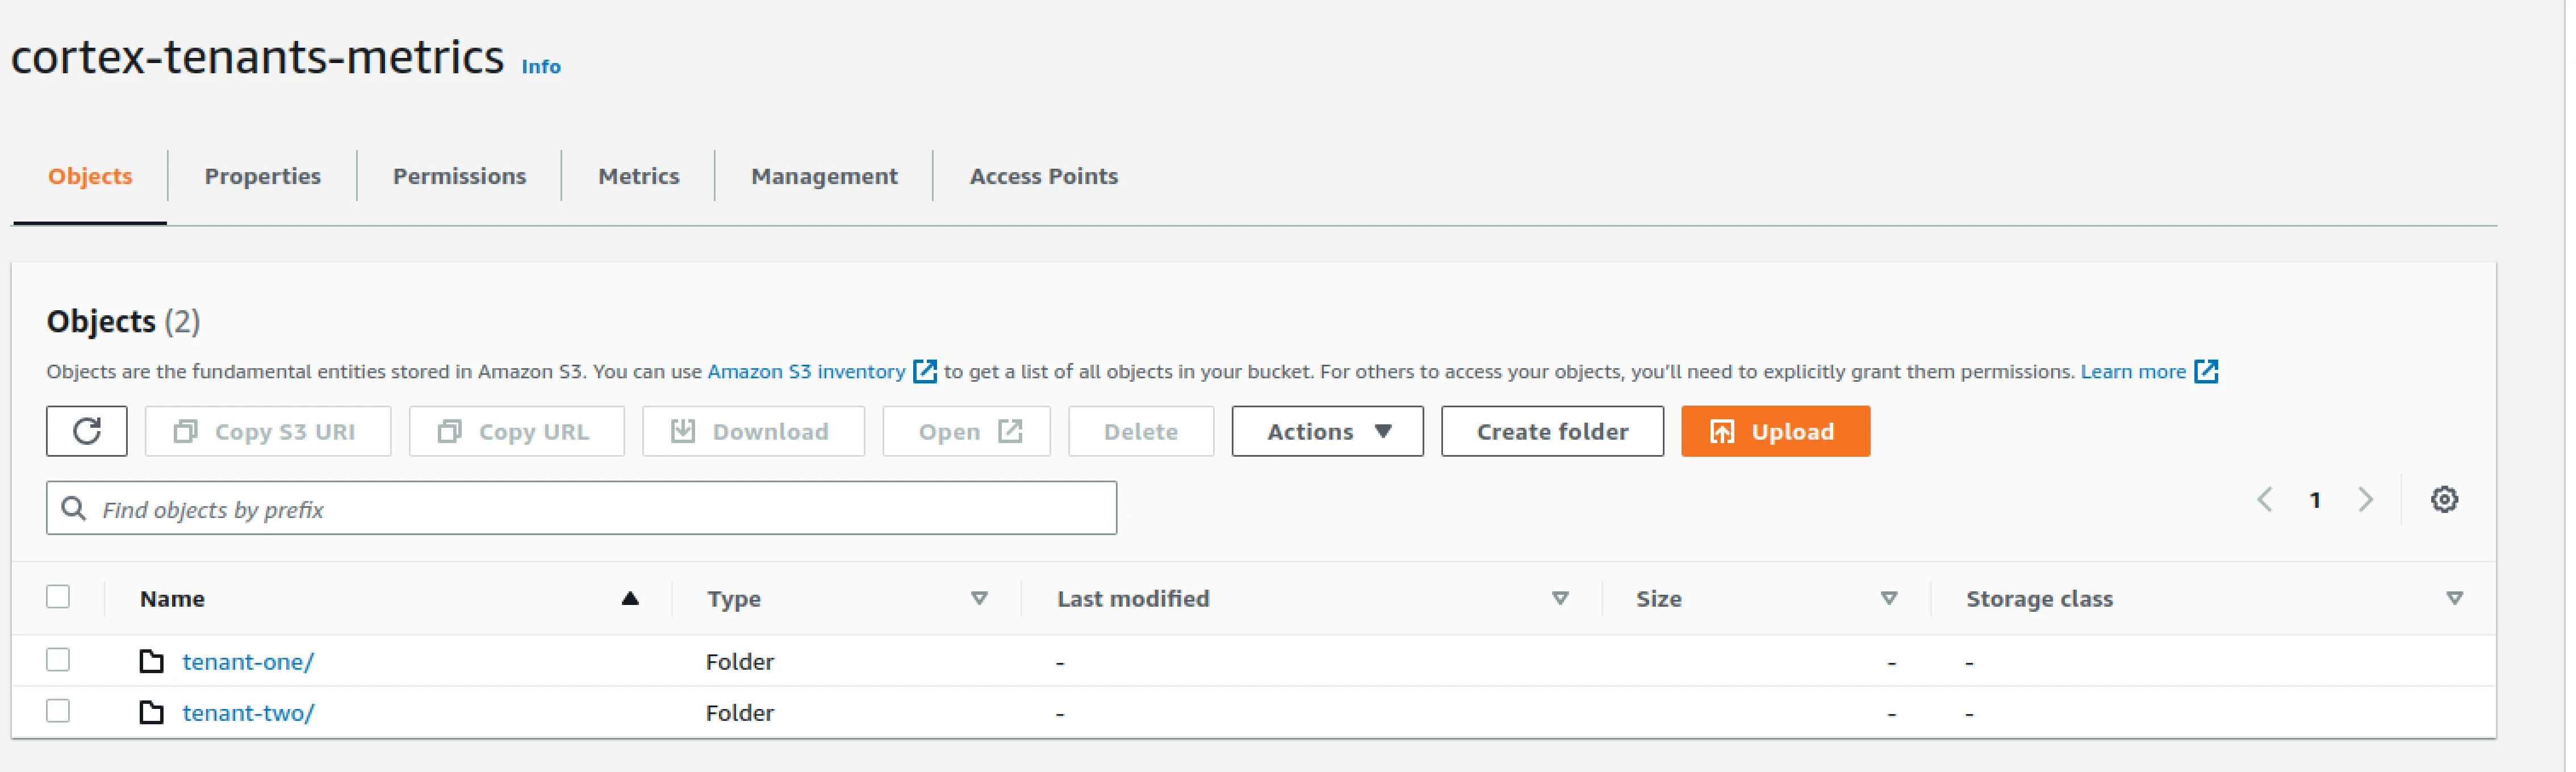
Now we have configured Amazon S3 to store our metrics; it will create separate folders based on tenant_id label that we have set in externalLabels. This is what it looks like:
Visualize the metrics with Grafana
Let’s visualize some data with Grafana. First, let’s add a datasource. Under the HTTP URL section, add LoadBalancer address http://172.18.255.200/api/prom. You can have a look here for Cortex APIs.
Under custom HTTP headers as Header as X-Scope-OrgID and value as tenant-one|tenant-two (use | for cross tenant querying)
So now, if we write a single PromQL query, this will show metrics from both clusters as follows:
Let’s check the number of pods on tenant-one cluster and tenant-two cluster.
count(kube_pod_info{__tenant_id__="tenant-one"})
We can see there are 32 in the screenshot below.

Run the same query on tenant-two
count(kube_pod_info{__tenant_id__="tenant-two"})
We can see there are 15 in the screenshot below.

Now, let’s use a single query that shows the total number of pods from both clusters.
count(kube_pod_info{})
So, by running the above single query, we can see the total number of pods from both clusters. Similarly, we can write advanced queries to get multi-tenant metrics from a single query.

Case studies
Here are several case studies where companies use Cortex to scale and provide more value to their audience.
-
Gojeck used it for monitoring needs: Gojek, founded in 2010, initially began as a call center facilitating motorcycle taxi bookings in Indonesia. Gojek’s mobile wallet, GoPay, and its super app, which encompasses over 20 different services, have become instrumental in the region. Whether you want to order a meal, schedule a massage, or purchase movie tickets, the Gojek app offers a convenient solution for all of these needs and more. Because it supports remote_write, Cortex enabled one of Gojek’s key needs: the ability to offer monitoring as a service.
-
Buoyant released new features: Buoyant has created Buoyant Cloud, a global platform health dashboard for Kubernetes. Leveraging Linkerd’s integration with Prometheus, Buoyant Cloud rolls up Linkerd metrics across all Kubernetes clusters to provide global platform-wide observability, including advanced features such as cross-cluster Service Level Objectives for success rate and latency.
-
REWE maintained the supply: REWE digital builds the technology that drives the e-commerce, app, and food pickup and delivery services for one of Germany’s largest grocery chains. Like other companies involved in the food supply chain, REWE has seen demand spike during the Covid-19 pandemic. Thanks to its adoption of Cortex last year, the monitoring team has been able to ensure stability at a growing scale.
-
With all the possibilities opened by Cortex, AWS, and Grafana Labs are scaling Cortex for the cloud. In their team’s words: ‘When we decided to offer a monitoring solution purpose-built for container users, supporting Prometheus use-case patterns quickly became necessary. However, using Prometheus at a cloud scale is difficult. We studied different architectures such as Prometheus plus a dedicated time series database, Thanos, and Cortex. Cortex quickly stood out as the most appropriate choice for long-term scalability in a multi-tenant environment, given its microservices design running on Kubernetes.’
Thanos vs Cortex vs Mimir
Thanos and Cortex have very similar objectives: aggregate metrics, store them in block storage, and have a single pane of glass for all your data.
Both the projects started with slightly different ways of achieving these objectives: Thanos talks to multiple Prometheus like endpoints and Cortex is a centralized place to write metrics using Prometheus remote write. In the last couple of years, these projects have worked together and have now become a lot more similar. They even share components, query optimization logic, and more. Both support multiple tenants, but Cortex is built with multi-tenant cases in mind; it even has its own multi-tenant aware Alertmanager.
Mimir is built by Grafana after 5 years of contributions to Cortex. It has some optimizations done by Grafana for their Grafana Enterprise Metrics (GEM) product. These include support for high cardinality metrics using a horizontally scalable compactor and a sharded query engine. You can read the Mimir announcement by Grafana for more details.
Conclusion
Cortex serves as a robust solution, effortlessly managing multiple Prometheus servers - and ensuring a user-friendly experience by simplifying operations and usage. While Thanos does offer a similar set of features – the way they set it up is drastically different. The use cases an organization is trying to implement will drive the choice of Cortex vs Thanos. But with Cortex, you can indeed run a highly scalable and resilient Prometheus based monitoring system easily.
I hope you found this post informative and engaging. I’d love to hear your thoughts on this post; let’s connect and start a conversation on LinkedIn.
Looking for help with observability stack implementation and consulting? Do check out how we’re helping startups & enterprises as an observability consulting services provider.
Stay updated with latest in AI and Cloud Native tech
We hate 😖 spam as much as you do! You're in a safe company.
Only delivering solid AI & cloud native content.
Posts You Might Like