Monitoring Kubernetes with Prometheus Operator

Unless you’ve been living under a rock, you’ve probably heard about Kubernetes, an open-source container orchestration platform designed to automate the deployment, scaling, and management of containerized applications. Kubernetes is great, solves the pain points of application deployment and maintenance in a distributed system but what makes it awesome is its extensibility. Operators are one such powerful concept that makes use of this capability. In this post, we will take a dive into Prometheus operator, how to install and of course using the Prometheus operator to monitor a demo application.
What are Kubernetes operators?
Introduced in 2016 by CoreOS, an Operator is a method of packaging, deploying and managing a Kubernetes application. A Kubernetes application is an application that is both deployed on Kubernetes and managed using the Kubernetes APIs and Kubernetes tooling such as Kubectl.
In other words, an operator is an application specific custom controller that works directly with Kubernetes API as such it can create, configure, manage instances of complex stateful applications according to the custom rules written inside our custom controller.
Before we go any further into the details, lets dial it back a little to understand two important concepts which bring Operators to life.
A Custom Resource is an object that extends the Kubernetes API or allows you to introduce your own API into a Kubernetes cluster. A Custom controller handles in-built Kubernetes objects, such as Deployment, Service in new ways, or manage custom resources as if they were native kubernetes components. Naturally, custom controllers are most effective when combined with custom resources and operator pattern is one such combination.
A bit more about operator
As explained earlier, an operator builds upon the two central Kubernetes concepts Resource and Controller and adds knowledge or configurations that allows the operator to execute common application tasks. They ultimately help you focus on the desired configuration, not the details of manual deployment and life cycle management. Let’s look at it from an example, for example when scaling an etcd cluster manually, a user has to perform a number of steps:
- create a DNS name for the new etcd member
- launch the new etcd instance
- use the etcd administrative tools (etcdctl member add) to tell the existing cluster about this new member
Instead with the etcd operator, a user can simply increase etcd cluster size field by 1.
What are some use cases of operator?
A Kubernetes Operator can:
- Install and provide initial configuration and sizing for your deployment
- Perform live scale reloading for any user-requested parameter modification (hot config reloading)
- Automatically scale up or down according to performance metrics
- Perform backups, integrity checks or any other maintenance task
What is a Prometheus operator?
Getting a kubernetes cluster up and running is very easy, but when you start deploying applications you are bound to run into some issues, coupled with the fact that Kubernetes being a distributed system makes troubleshooting not so trivial. Recently graduated from CNCF Prometheus has become the standard tool for monitoring and alerting in Kubernetes and container world. It provides by far the most detailed and actionable metrics and analysis. Prometheus-operator is a CoreOS conception that provides easy monitoring definitions for Kubernetes services, deployment and management of Prometheus instances.
Once deployed, Prometheus Operator provides the following features:
- Create/Destroy: Easily launch a Prometheus instance for your Kubernetes namespace, a specific application or team easily using the Operator
- Simple Configuration: Configure the fundamentals of Prometheus like versions, persistence, retention policies, and replicas from a native Kubernetes resource
- Target Services via Labels: Automatically generate monitoring target configurations based on familiar Kubernetes label queries; no need to learn a Prometheus specific configuration language
Well, how does a Prometheus operator work?
The main idea behind is to decouple the deployment of Prometheus instances from the configuration of the entities they are monitoring. To implement this functionality, the Prometheus operator introduces additional resources and abstractions as Custom Resource Definitions(CRD)
- Prometheus : Defines a desired Prometheus deployment
- ServiceMonitor : Specifies how a group of services are to be monitored with hte help of labels. Similar to how Services monitor endpoints
- AlertManager : Defines a desired AlertManager deployment
- PrometheusRule: Defines a desired Prometheus rule file, which can be loaded by a Prometheus instance containing Prometheus alerting and recording rules.
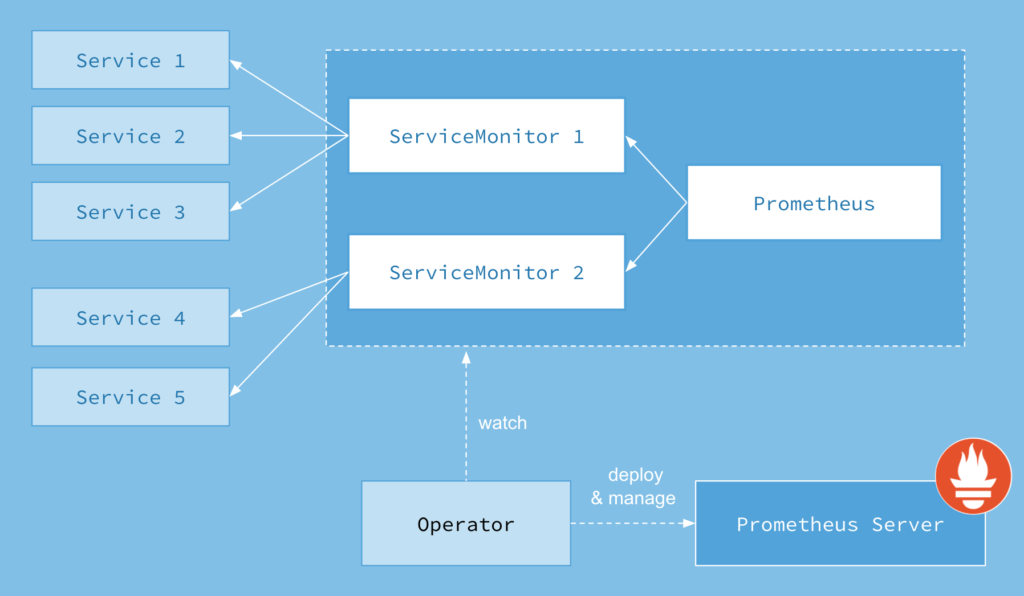
Image Credits: CoreOS
From the picture above you can see that you can create a ServiceMonitor resource which will scrape the Prometheus metrics from the defined set of pods. Basically, the Operator instructs Prometheus to watch over the kubernetes API and upon detecting changes, creates a new set of configuration for the new service.
Enough theory, let’s deploy a Prometheus operator:
To install the prometheus operator (prometheus-operator:v0.25.0), lets start by applying the manifests one by one and explain the reasoning behind it them. To get this started , you’ll need a kubernetes cluster you have access to, also the following set of deployments makes the assumption that RBAC is enabled on your cluster.
$ git clone git@github.com:ipochi/prometheus-operator-demo.git $ cd prometheus-operator-demo
Below action deploys the prometheus operator, its ClusterRole, ClusterRoleBinding and the ServiceAccount.It grants the Prometheus Operator the following cluster-wide permissions:
- read access to pods, nodes, and namespaces.
- read/write access to services and their endpoints.
- full access to secrets, ConfigMaps , StatefulSets, Prometheus-related resources (alert managers, service monitors,etc)
$ kubectl apply -f manifests/prometheus-operator.yaml
Check if the operator is successfully deployed or not. You should see the output similar to below
$ kubectl get crd NAME CREATED AT alertmanagers.monitoring.coreos.com 2018-11-29T17:38:34Z prometheuses.monitoring.coreos.com 2018-11-29T17:38:34Z prometheusrules.monitoring.coreos.com 2018-11-29T17:38:35Z servicemonitors.monitoring.coreos.com 2018-11-29T17:38:35Z
$ kubectl get pods -n default NAME READY STATUS RESTARTS AGE prometheus-operator-c4b75f7cd-w28kw 1/1 Running 0 18m
$ kubectl get serviceaccount | grep prometheus prometheus 1 21m prometheus-operator 1 21m
$ kubectl get clusterrolebinding | grep prometheus prometheus 22m prometheus-operator 22m
$ kubectl get clusterrole | grep prometheus prometheus 22m prometheus-operator 23m
Next up is the ClusterRole and ClusterRoleBinding for the Prometheus Pods. Assuming that RBAC authorization is activated, we need to create RBAC rules for both Prometheus and Prometheus Operator. A ClusterRole and a ClusterRoleBinding for the Prometheus Operator were created in the first step.The same must be done for the Prometheus Pods. The below manifest creates a ClusterRole and ClusterRoleBinding for the Prometheus pods
$ kubectl apply -f manifests/prometheus-pods-rbac.yaml
We have deployed Prometheus operator, respective CRDs and corresponding ClusterRole and ClusterRoleBindings for both operator and its pods. There are a couple of things left to deploy namely the Prometheus Pods, ServiceMonitors for providing the scraping configuration and Service to expose Prometheus onto a specific node port, but first, we will deploy our demo application and we will get to the remaining parts as we go along.
Let’s monitor a Kubernetes application with Prometheus operator:
We will be installing microservices-demo application from weaveworks. More about the microservices-demo application. Apply the manifests for deploying the application
$ kubectl create namespace sock-shop $ kubectl apply -f https://raw.githubusercontent.com/microservices-demo/microservices-demo/master/deploy/kubernetes/complete-demo.yaml
Check if the application is deployed and we can access the front end service on the port 30001.
$ kubectl get svc,deployments -n sock-shop NAME TYPE CLUSTER-IP EXTERNAL-IP PORT(S) AGE service/carts ClusterIP 10.102.153.164 80/TCP 24m service/carts-db ClusterIP 10.104.239.239 27017/TCP 24m service/catalogue ClusterIP 10.109.119.32 80/TCP 24m service/catalogue-db ClusterIP 10.106.130.138 3306/TCP 24m service/front-end NodePort 10.99.139.102 80:30001/TCP 24m service/orders ClusterIP 10.102.230.115 80/TCP 24m service/orders-db ClusterIP 10.101.241.231 27017/TCP 24m service/payment ClusterIP 10.106.171.190 80/TCP 24m service/queue-master ClusterIP 10.106.16.104 80/TCP 24m service/rabbitmq ClusterIP 10.106.177.36 5672/TCP 24m service/shipping ClusterIP 10.98.16.105 80/TCP 24m service/user ClusterIP 10.109.22.162 80/TCP 24m service/user-db ClusterIP 10.98.190.154 27017/TCP 24m
NAME DESIRED CURRENT UP-TO-DATE AVAILABLE AGE deployment.extensions/carts 1 1 1 1 24m deployment.extensions/carts-db 1 1 1 1 24m deployment.extensions/catalogue 1 1 1 1 24m deployment.extensions/catalogue-db 1 1 1 1 24m deployment.extensions/front-end 1 1 1 1 24m deployment.extensions/orders 1 1 1 1 24m deployment.extensions/orders-db 1 1 1 1 24m deployment.extensions/payment 1 1 1 1 24m deployment.extensions/queue-master 1 1 1 1 24m deployment.extensions/rabbitmq 1 1 1 1 24m deployment.extensions/shipping 1 1 1 1 24m deployment.extensions/user 1 1 1 1 24m deployment.extensions/user-db 1 1 1 1 24m
All services in our demo application expose metrics via the /metrics endpoint, this information needs to be provided to Prometheus pods so that it can scrape our metrics. ServiceMonitors are just the thing that we need for this task. Lets create ServiceMonitor for our front-end service. Our front-end service exposes the metrics at containerPort 8079 via /metrics path.
ServiceMonitor works in the same manner of label selection as Pods and Services. In the above yaml, we are specifying the selector to match the label front-end against all the services that are present in the namespace sock-shop and our target being container port 8079 and path /metrics. Similarly, you’ll find that we have created other service monitors for the remaining services in our application. Let’s apply them all.
$ kubectl apply -f manifests/service-monitors/
To verify that everything is working correctly.
$ kubectl get servicemonitors -n sock-shop NAME AGE sock-shop-carts 26m sock-shop-catalogue 26m sock-shop-front-end 26m sock-shop-orders 26m sock-shop-payment 26m sock-shop-shipping 26m sock-shop-user 26m
Now, onto the creation of Prometheus pod manifest in which we will provide the information as to which ServiceMonitors it needs to pick for scraping.
$ kubectl apply -f manifests/prometheus.yaml
This tells Prometheus pods to scrap from those ServiceMonitor’s with the labels [front-end, carts, catalogue, orders, payment, shipping, user]. Let’s verify if our Prometheus pods are up and running in the default namespace.
$ kubectl get pods -n default NAME READY STATUS RESTARTS AGE prometheus-operator-c4b75f7cd-w28kw 1/1 Running 0 28m prometheus-prometheus-0 3/3 Running 1 26m prometheus-prometheus-1 3/3 Running 2 26m
Only thing that’s left to do here, is to expose our Prometheus pods via NodePort service, below yaml does just that.
$ kubectl apply -f manifests/service.yaml
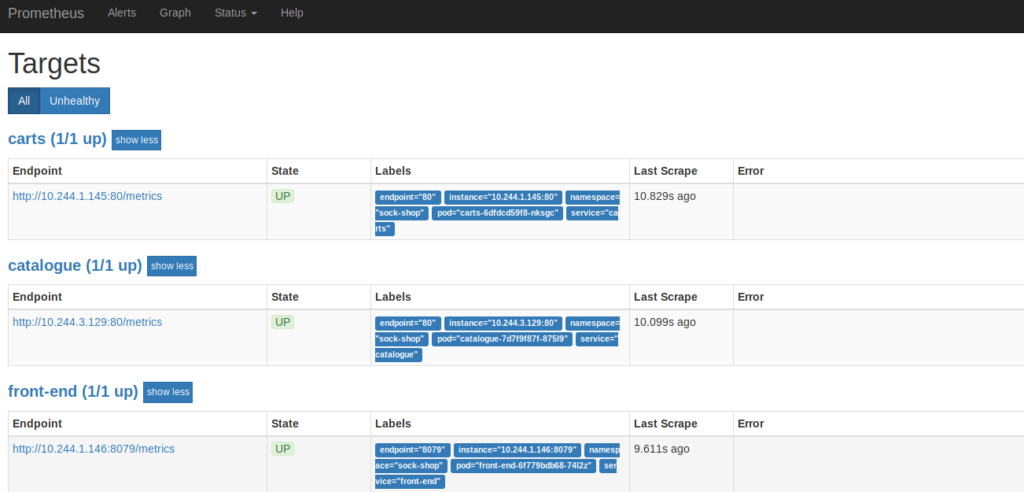
To confirm our Prometheus pods are scraping the services, let’s point our browser to :30900. Navigate to the Status dropdown and select Targets. Our services should be listed there.
Operator vs Helm
There is a small overlap with Helm as both perform application setup. Helm is a package manager, a good way to organize applications (deployment, service etc. templates packaged into one tar). An analogy for helm would be like ‘apt’ tool used in Ubuntu for Kubernetes. Operators enable you to manage the operation of applications within Kubernetes using custom resources and controllers. A Helm chart by comparison is a way to template out K8s objects to make them configurable for different environments. As such both of them are complimentary, lifecycle management of an Operator can be done using kubectl or Helm. you can use helm charts to deploy an operator as well.
Conclusion
Application monitoring is an important part of our application stack, with the help of Prometheus operator, we were able to implement our application monitoring with less effort, in a more declarative and reproducible manner, which is easier to scale, modify or migrate to a different set of hosts.
And that’s a wrap on how you can monitor Kubernetes with Prometheus operator! If you’d like to learn more about Prometheus, you can follow our Prometheus definitive guide series - Prometheus Metrics and use cases and the next one on Prometheus Query Language.
Hope you enjoyed and found this article informative. Do follow us on LinkedIn and Twitter for more blog like this.
Looking for help with observability stack implementation and consulting? do check out how we’re helping startups & enterprises as an observability consulting services provider and our Prometheus enterprise support partner.
Stay updated with latest in AI and Cloud Native tech
We hate 😖 spam as much as you do! You're in a safe company.
Only delivering solid AI & cloud native content.
Posts You Might Like