Log Monitoring and Alerting with Grafana Loki

In a production environment, a downtime of even a few microseconds is intolerable. Debugging such issues is time-critical. Proper logging and monitoring of infrastructure help in debugging such scenarios. It also helps in optimizing cost and other resources proactively. It also helps to detect any impending issue which may arise in the near future. There are various logging and monitoring solutions available in the market.
In this post, we will walk through the steps to deploy Grafana Loki in a Kubernetes environment for log monitoring and alerting. This is due to its seamless compatibility with Prometheus; a widely used software for collecting metrics. Grafana Loki consists of three components Promtail, Loki, and, Grafana (PLG) which we will see in brief before proceeding to the deployment. This article provides a better insight into the architectural differences of PLG and other primary logging and monitoring stack like Elasticsearch-FluentD-Kibana (EFK).
Logging, Monitoring and Alerting with Grafana Loki
Before proceeding with the steps for deploying Grafana Loki, let’s look at each tool briefly.
What is Promtail and how to use it?
Promtail helps to monitor applications by shipping the container logs to Loki or Grafana cloud. This process primarily involves discovering targets, attaching labels to log streams from both log files and the systemd journal, and shipping them to Loki. Promtail’s service discovery is based on the Prometheus’ service discovery mechanism.
What is Loki Grafana and how to use it?
As quoted by creators of Loki, Loki is a horizontally-scalable, highly-available, multi-tenant log aggregation system inspired by Prometheus. Loki uses the same service discovery mechanism as that of Prometheus and adds labels to the log stream instead of indexing. Due to which, logs received from Promtail consist of the same set of labels as that of application metrics. Thus, it not only provides better context switching between logs and metrics but also avoids full index logging.
What is Grafana and how to use it?
Grafana is an open-source platform for monitoring and observability. It specifically operates on time-series data coming from sources like Prometheus and Loki. Moreover, it allows you to query, visualize, alert on the metrics regardless of its stored location. It helps to create, explore, and share dashboards and encourages data-driven culture.
How to deploy/install PLG (Promtail-Loki-Grafana) stack?
To deploy/install the PLG stack, we will use the respective Helm charts and modify their values according to our requirements. At first, we will install Prometheus-Operator (since it includes Prometheus, Alert-Manager, and Grafana). Then, we will install Loki-stack (which includes Promtail) following with Nginx.
How do you install Loki Grafana?
For installing/deploying Loki, let us create a loki-stack-values.yaml and add the values as per our requirement.
# Loki Stack Values
promtail:
    serviceMonitor:
      enabled: true
      additionalLabels:
        app: prometheus-operator
        release: prometheus

    pipelineStages:
    - docker: {}
    - match:
        selector: '{app="nginx"}'
        stages:
        - regex:
            expression: '.*(?P<hits>GET /.*)'
        - metrics:
            nginx_hits:
              type: Counter
              description: "Total nginx requests"
              source: hits
              config:
                action: inc
We enable service monitor for the Promtail and add appropriate labels so that it syncs with the Prometheus easily. Loki transforms a log line, changes its labels, and change the format of the timestamp using the various stages structured in a pipeline as given in here. In the snippet shown above, there is a match stage that runs only if the scraped config has key=app and value=nginx. The next stage filters out the log line that contains the word hits followed by GET with the help of regular expression.
In the metrics stage, we define the nginx_hits metric. Promtail exposes this custom metric through its /metrics endpoint. We have defined the metric type as a counter that will get incremented (as defined in action) when hits (source) are filtered out from the regex stage. In order to reflect this metric in Prometheus; Prometheus should scrape Promtail. In this way, we can create a custom metric from the container logs. Moreover, we can also scale the deployments based on such custom metrics as explained in this post.
To install Loki run the following commands:
helm3 repo add loki https://grafana.github.io/loki/charts
helm3 repo update
helm3 upgrade --install loki loki/loki-stack --values=loki-stack-values.yaml
How to install Prometheus-Operator?
Create a prom-oper-values.yaml and add the following values to it:
grafana:
    additionalDataSources:
      - name: loki
        access: proxy
        orgId: 1
        type: loki
        url: http://loki:3100
        version: 1

additionalPrometheusRules:
  - name: loki-alert
    groups:
      - name: test_nginx_logs
        rules:
        - alert: nginx_hits
          expr: sum(increase(promtail_custom_nginx_hits[1m])) > 2
          for: 2m

alertmanager:
  config:
    global:
      resolve_timeout: 1m
    route:
      group_by: ['alertname']
      group_wait: 3s
      group_interval: 5s
      repeat_interval: 1m
      receiver: slack-notifications
      routes:
      - match:
          alertname: nginx_hits
        receiver: slack-notifications
    receivers:
    - name: 'slack-notifications'
      slack_configs:
      - api_url: 'https://hooks.slack.com/services/ABCD1234/ABCD567'
        channel: '#test'
In this, we have added configuration for the Grafana to add Loki as the data source. Next, we have configured the rule to push alert with the name nginx_hits. These rules are grouped together to execute them sequentially at regular intervals. The threshold for firing an alert is set in the expr. The rule defined in this way helps to precompute expressions, owing to which you can have faster execution of expressions.
The PromQL expression (expr) defined as threshold, evaluates at the current time. It records the result as a new set of time series under the defined metric name. The expression which we have used consists of increase function. It calculates the difference between the counter values over a period of time (1 min). sum aggregates the nginx_hits from multiple counters. An alert is fired when the condition in the expr persists for a given period of time. The for clause helps Prometheus to verify whether the alert is active during each evaluation time and fires alert accordingly. Alerts remain in Pending state before entering into the Firing state.
Lastly, we configure Alertmanager to send the notification over Slack. Alertmanager follows a tree structure for routing the incoming alerts. We can form groups of alerts based on alertname, jobs, cluster, etc. A notification is sent on the pre-defined receiver when a matching alert is identified. In this case, we have defined the receiver as slack-notifications. receiver consists of configuration for the required Slack channel and its webhook URL.
helm3 upgrade --install prometheus stable/prometheus-operator --values=prom-oper-values.yaml
Next, we deploy Nginx and the yaml for the same can be found here. Nginx is exposed via NodePort.
kubectl apply -f nginx.yaml
We will once verify the running status of all the Pods.
└─ $ ▶ kubectl get pods
alertmanager-prometheus-prometheus-oper-alertmanager-0   2/2     Running   0          3m14s
loki-0                                                   1/1     Running   0          82s
loki-promtail-n494s                                      1/1     Running   0          82s
nginx-deployment-55bcb6c8f7-f8mhg                        1/1     Running   0          42s
prometheus-grafana-c4bcbbd46-8npgt                       2/2     Running   0          3m44s
prometheus-kube-state-metrics-6d6fc7946-ts5z4            1/1     Running   0          3m44s
prometheus-prometheus-node-exporter-jwz64                1/1     Running   0          3m44s
prometheus-prometheus-oper-operator-f8df9fcf9-kc5wc      2/2     Running   0          3m44s
prometheus-prometheus-prometheus-oper-prometheus-0       3/3     Running   1          3m2s
How to enable Logging, Monitoring and Alerting?
To simulate the condition for firing the alert we will run the following shell commands. This will hit the Nginx URL after every 10 seconds.
└─ $ ▶ while true; do curl --silent --output /dev/null --write-out '%{http_code}' $(minikube service nginx --url); sleep 10; echo; done
200
200
After login into the Grafana, click on the Explore tab. Select data source as Loki and enter the {app=”nginx”} in Log labels. Note that metadata of Nginx deployment contains the label app=nginx which is the same that filters out logs in Loki.
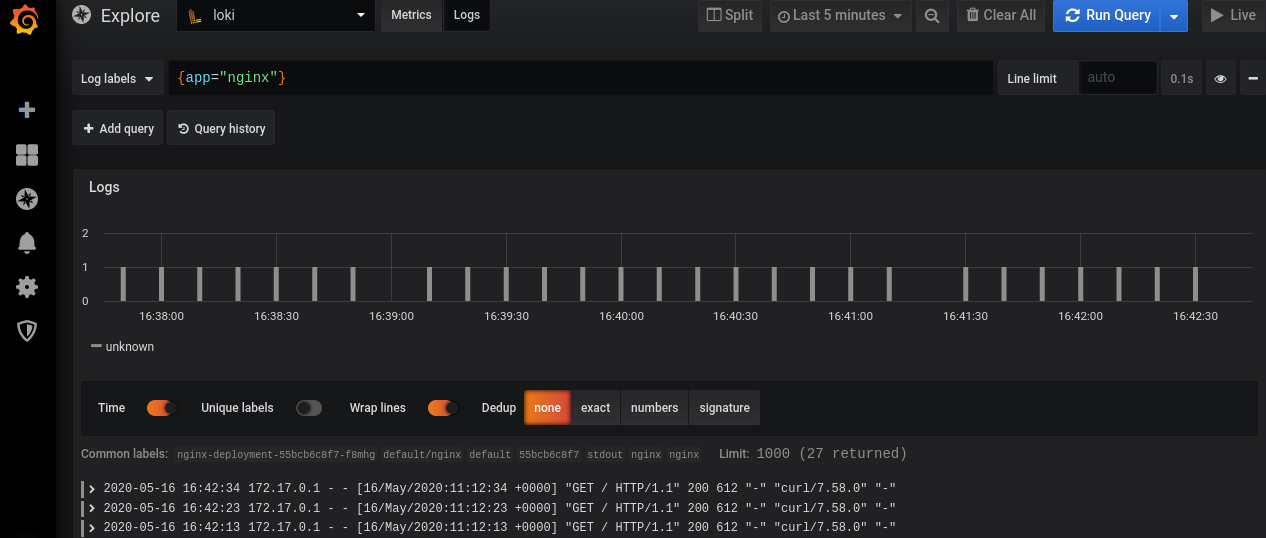
Grafana Dashboard displaying logs from Loki
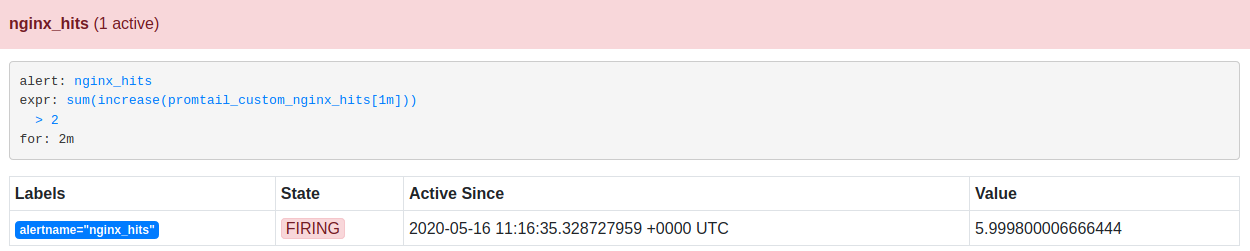
Alerts enter into the Pending state as soon as its condition satisfies. This is verified in Prometheus’ dashboard under ‘Alerts’ tab.
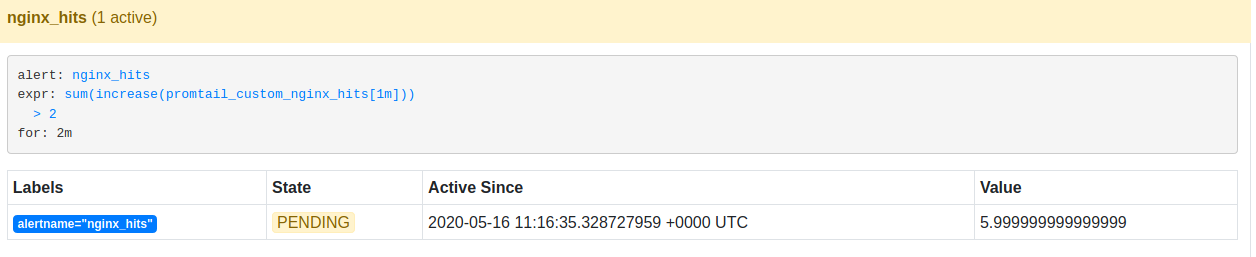
If this alert is active for 2 mins, it then enters into the Firing state.
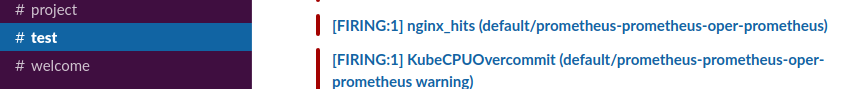
Once the alert enters into the Firing state, it propagates and gets notified to the respective Slack channel. The figure below shows nginx_hits alert notification in the test channel.
Conclusion
The main motive of this post is to demonstrate how you can enable logging, monitoring, and alerting with PLG stack. In short, one should consider using Grafana Loki a.k.a PLG due to the following aspects:
- All the three tools are open-source with a large community support
- It can be easily integrated with Prometheus
- You can easily create a metric from logs e.g. nginx_hits as shown in the previous section
- With a single Grafana dashboard, you can monitor both logs and metrics.
If you enjoyed this blog, do read my latest article on how to enable tracing in Grafana with Tempo and Jaeger here. Let’s connect and continue the conversation on Twitter.
Looking for help with observability stack implementation and consulting? do check out how we’re helping startups & enterprises as an observability consulting services provider.
References
Header and Featured image from Freepik
Stay updated with latest in AI and Cloud Native tech
We hate 😖 spam as much as you do! You're in a safe company.
Only delivering solid AI & cloud native content.
Posts You Might Like