Kubernetes Autoscaling with Custom Metrics (updated)

In the previous blog post about Kubernetes autoscaling, we looked at different concepts and terminologies related to autoscaling such as HPA, cluster auto-scaler etc. In this post will do a walkthrough of how kubernetes autoscaling can be implemented for custom metrics generated by the application.
Why custom metrics?
The CPU or RAM consumption of an application may not indicate the right metric for scaling always. For example, if you have a message queue consumer which can handle 500 messages per second without crashing. Once a single instance of this consumer is handling close to 500 messages per second, you may want to scale the application to two instances so that load is distributed across two instances. Measuring CPU or RAM is a fundamentally flawed approach for scaling such an application and you would have to look at a metric which relates more closely to the application’s nature. The number of messages that an instance is processing at a given point in time is a better indicator of actual load on that application. Similarly, there might be applications where other metrics makes more sense and these can be defined using custom metrics in Kubernetes.
Metrics pipelines
Metrics Server & API
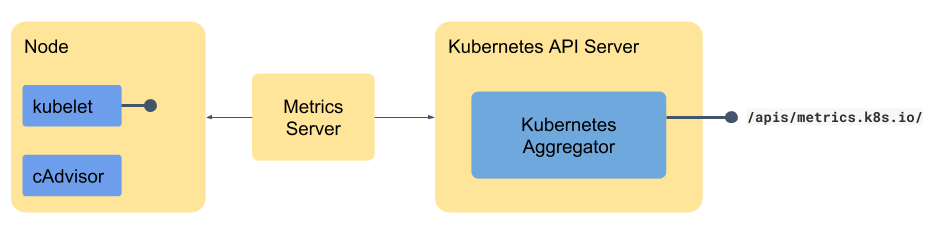
Originally the metrics were exposed to users through Heapster which queried the metrics from each of Kubelet. The Kubelet, in turn, talked to cAdvisor on localhost and retrieved the node level and pod level metrics. The metrics-server was introduced to replace Heapster and use the Kubernetes API to expose the metrics so that the metrics are available in the same manner in which Kubernetes API is available. The metrics server aims to provides only the core metrics such as memory and CPU of pods and nodes and for all other metrics, you need to build the full metrics pipeline. The mechanisms for building the pipeline and Kubernetes autoscaling remain the same, as we will see in detail in the next few sections.
Aggregation Layer
One of the key pieces which enable exposing the metrics via the Kubernetes API layer is the aggregation layer. The aggregation layer allows installing additional APIs which are Kubernetes style into the cluster. This makes the API available like any Kubernetes resource API but the actual serving of the API can be done an external service which could be a pod deployed into the cluster itself (You need to enable the aggregation layer if not done already at cluster level as documented here). So how does this work under the hood? As a user, the user needs to provide the API provider (Let’s say a pod running an API service) and then register the same using an APIService object.
Let’s take an example of core metrics pipeline and how metrics server registers itself using API aggregation layer. The APIService object looks like this:
apiVersion: apiregistration.k8s.io/v1
kind: APIService
metadata:
  name: v1beta1.metrics.k8s.io
spec:
  service:
    name: metrics-server
    namespace: kube-system
  group: metrics.k8s.io
  version: v1beta1
  insecureSkipTLSVerify: true
  groupPriorityMinimum: 100
  versionPriority: 100
After deploying the metrics server registering the API using APIService, we can see that the metrics API is available within Kubernetes API:
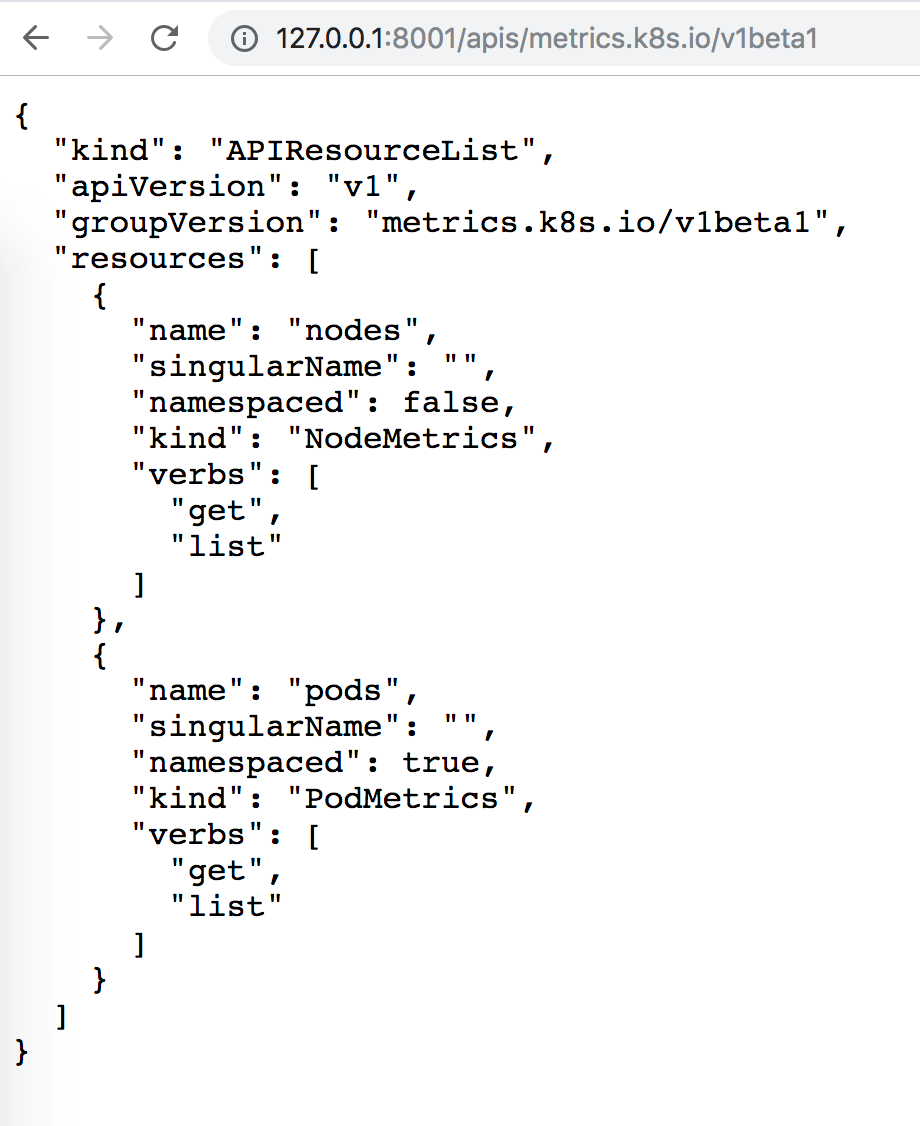
Metrics Pipeline - Core & Full
Having understood the basic components, let’s put them together to make a core metrics pipeline. In case of the core pipeline, if you have metrics server installed properly, it will also create the APIService to register itself on to Kubernetes API server. The metrics will be exposed at /apis/metrics.k8s.io as we saw in the previous section and will be used by HPA.
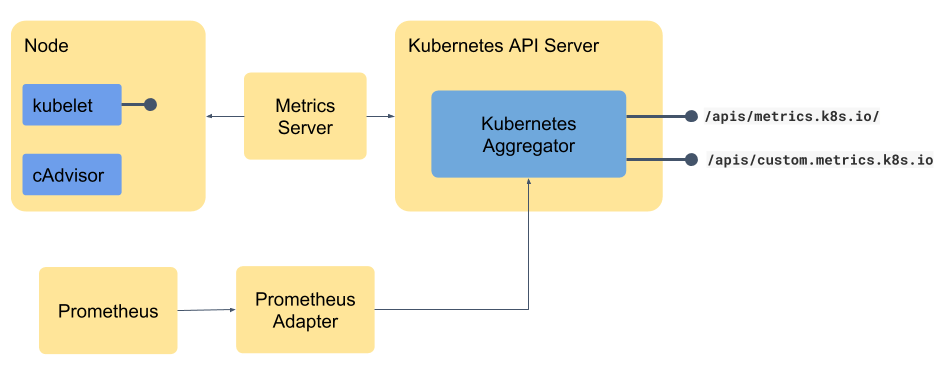
Most non-trivial applications need more metrics than just memory and CPU and that is why most organization use a monitoring tool. Some of the most commonly used monitoring tools are Prometheus, Datadog, Sysdig etc. The format which these monitoring tools use may vary from tool to tool. Before we can expose the endpoint using Kubernetes API aggregation we need to convert the metrics to the suitable format. That is where a small adapter - which may be part of the monitoring tool or may be available as a separate component bridges the gap between the monitoring tool and the Kubernetes API. For example, Prometheus has the Prometheus adapter or Datadog has Datadog Cluster Agent - they sit between the monitoring tool and the API and translate from one format to other as shown in the diagram below. These metrics are available at a slightly different endpoint so that they can be consumed appropriately.
Demo - Kubernetes Autoscaling
We will demonstrate using custom metrics to autoscale an application with Prometheus and Prometheus adapter using custom metrics. You can read through the rest of the post or straight away head to the GitHub repo and start building the demo on your own
Setting up Prometheus
In order to make the metrics available to the adapter, we will install Prometheus with the help of Prometheus Operator. It creates CustomResourceDefinitions to deploy components of Prometheus in the cluster. CRD is a way to extend Kubernetes resources. Using Operators makes it easy to configure and maintain Prometheus instances ‘the Kubernetes way’ (by defining objects in YAML files). CRDs created by Prometheus Operator are:
- AlertManager
- ServiceMonitor
- Prometheus
You can find more information about Prometheus Operator. You can follow the instructions mentioned here to setup Prometheus.
Deploying a demo application
To generate the metrics, we will deploy a simple application mockmetrics which generates total_hit_count value at /metrics. It’s a web server written in Go. The value of metric total_hit_count keeps on increasing when the URL is visited. It uses exposition format required by Prometheus, to display the metrics.
$ curl localhost:8080/metrics
# HELP total_hit_count Total requests to the end point
# TYPE total_hit_count counter
total_hit_count 22
Follow the instructions to create a deployment and service for this application, which will also create ServiceMonitor and HPA for the application.
The ServiceMonitor
ServiceMonitor creates a configuration for Prometheus. It mentions the label of the service, path, port, and interval at which the metrics should be scraped. With the help of label of service, pods are selected. Prometheus scrapes metrics from all the matching pods. Depending on your Prometheus configuration, the ServiceMonitor should be placed in the correct namespace. In our case, it’s in the same namespace as of mockmetrics.
Deploying and configuring Prometheus adapter
Now to provide custom.metrics.k8s.io API endpoint for HPA, we will deploy Prometheus adapter. The adapter expects it’s config file to be available inside the pod. We will create a configMap and mount it inside the pod. We will also create Service and APIService to create the API. APIService adds /api/custom.metrics.k8s.io/v1beta1 end point to the standard Kubernetes APIs. You can follow the instructions to achieve this. Let’s take a look at the configuration,
seriesQueryis used to query Prometheus for the resources with labels ‘default’ and ‘mockmetrics-service’.resourcessection mentions how the labels should be mapped to the Kubernetes resources. In our case, it maps the label ‘namespace’ with the Kubernetes ‘namespace’ and similar for service.metricsQueryis again the Prometheus query which does work of getting the metrics into the adapter. The query we are using gets the average of sum oftotal_hit_countfrom all pods matching the regexmockmetrics-deploy-(.*)over 2 minutes.
Kubernetes Autoscaling in action
Once you follow the steps, metrics value will keep increasing. Let’s take a look at HPA now.
$ kubectl get hpa -w
NAME                  REFERENCE                       TARGETS   MINPODS   MAXPODS   REPLICAS   AGE
mockmetrics-app-hpa   Deployment/mockmetrics-deploy   0/100     1         10        1          11h
mockmetrics-app-hpa   Deployment/mockmetrics-deploy   56/100    1         10        1          11h
mockmetrics-app-hpa   Deployment/mockmetrics-deploy   110/100   1         10        1          11h
mockmetrics-app-hpa   Deployment/mockmetrics-deploy   90/100    1         10        2          11h
mockmetrics-app-hpa   Deployment/mockmetrics-deploy   126/100   1         10        2          11h
mockmetrics-app-hpa   Deployment/mockmetrics-deploy   306/100   1         10        2          11h
mockmetrics-app-hpa   Deployment/mockmetrics-deploy   171/100   1         10        4          11h
You can see how the number of replicas increase, when the value reaches the target value.
The flow
The overall flow of this autoscaling is explained in the diagram below.
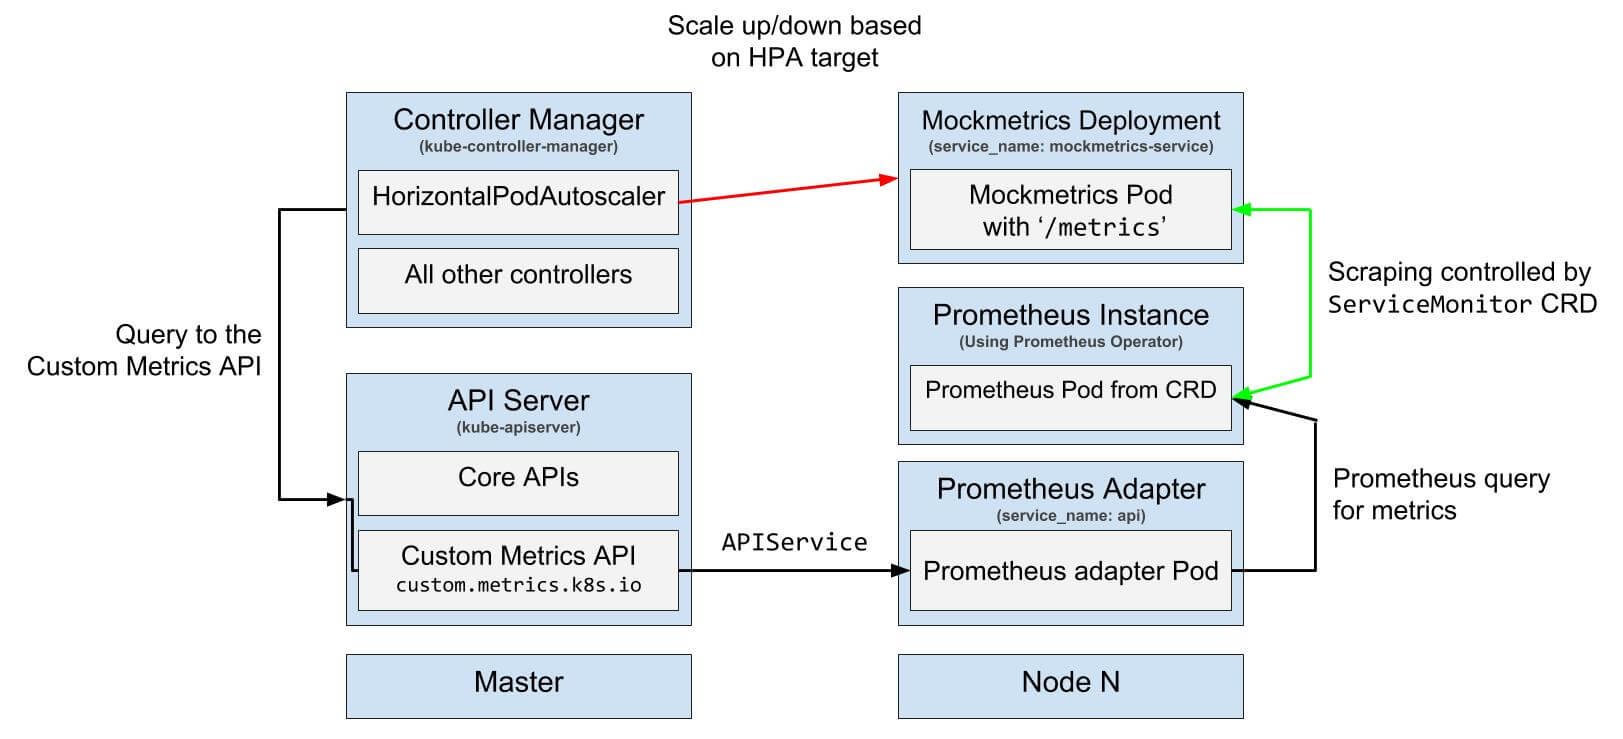
Image credits: luxas/kubeadm-workshop, Licensed under MIT License.
Conclusion
You can learn more about relevant projects and references here. The monitoring pipeline in Kubernetes has evolved a lot in last few releases and Kubernetes autoscaling largely works based on it. If you are not familiar with the landscape it is easy to get confused and lost.
Looking for help with Kubernetes adoption or Day 2 operations? learn more about our capabilities and why startups & enterprises consider as one of the best Kubernetes consulting services companies.
Stay updated with latest in AI and Cloud Native tech
We hate 😖 spam as much as you do! You're in a safe company.
Only delivering solid AI & cloud native content.
Posts You Might Like