Beginner's Guide to Kuma Service Mesh

The concept of service mesh emerged as a response to the growing popularity of cloud native environments, microservices architecture, and Kubernetes. It has its roots in the three-tiered model of application architecture. While Kubernetes helped resolve deployment challenges, the communication between microservices remained a source of unreliability. Under a heavy load, the application could break if the traffic routing, load balancing, etc. were not optimized. This led to the growth of service mesh. With the existing service mesh hard to scale due to too many moving parts, configure and manage, Kong built a service mesh tool called Kuma.
In this blog post, we will be talking about the open source service mesh Kuma, its architecture, and its easy-to-implement policies like traffic control, metrics, circuit breaking, etc. We will also discuss how Kuma provides better observability of services.
What is Kuma?
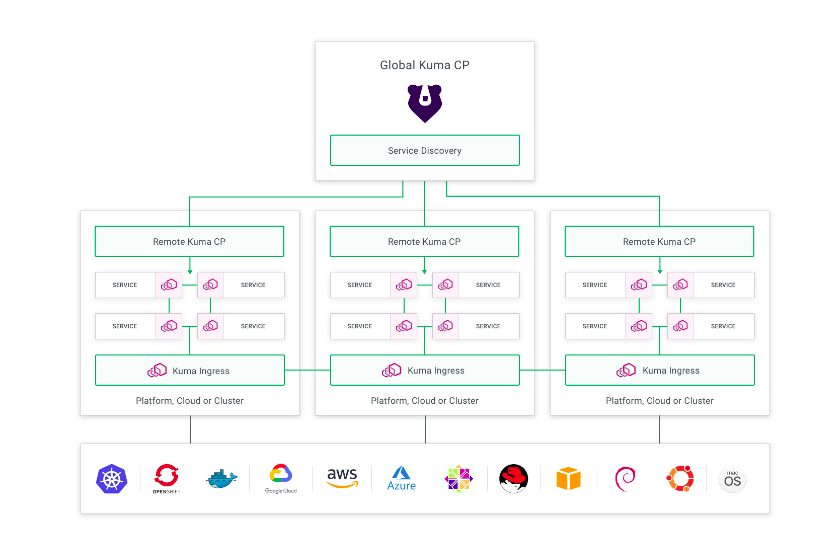
Kuma is an open source service mesh for Kubernetes, VM, and bare metal environments. Along with horizontal scalability support, it also offers multi-zone, multi-cluster, and multi-cloud support. It is enterprise-ready and supports multiple individual meshes as shown in the image below that helps lower the operating costs of supporting the entire organization.
Kuma architecture
In this section, we are going to talk about high-level visualization and the components of a Kuma service mesh. It will help us to understand how to integrate the application’s services into the mesh. There are two main following components.
-
Data plane: To deal with network complexities and segment the business logic, each service is deployed with a sidecar proxy. The proxy handles the traffic of the mesh. Kuma is built on top of the Envoy proxy. A data plane proxy is configured for each replica of the service to handle failure issues and also to assign an identity to the proxy and correspondingly to the service.
The data plane proxy (DPP) is composed of primarily two components:
Dataplane: It is the entity that has the data plane configuration. It has the inbounds and outbounds defined along with the IP address that other DPP use to search each other. For Kubernetes-based infrastructure, the control plane automatically generates theDataplane. For Universal setup, the user defines theDataplaneentity.kuma-dp: This is a binary that has spawned two subprocesses:envoy: This binary invokes Envoy and abstracts certain complexities of a proxy that are not required to be dealt with.core-dns: It resolves Kuma-specific DNS entries.
-
Control plane: With a production-grade deployment, there will be many data plane proxies to manage. You do not want to overburden your platform engineers with the manual tasks of updating policies, enabling monitoring and configurations on each data plane proxy. This is where the control plane comes into the picture. It helps with configuring the data plane proxies and managing the traffic going through the mesh.
Kuma is the control plane and is shipped in a
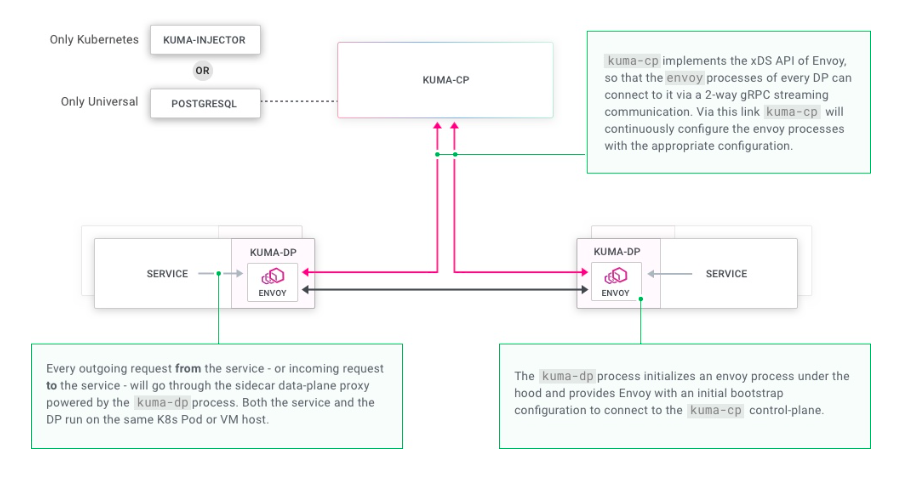
kuma-cpbinary in a mesh. For the data plane proxies to receive configurations from the control plane,kuma-cpimplements the Envoy xDS APIs. Kuma provides a CLI toolkumactlto interact with the control plane. Kuma maintains a data store based on the infrastructure mode.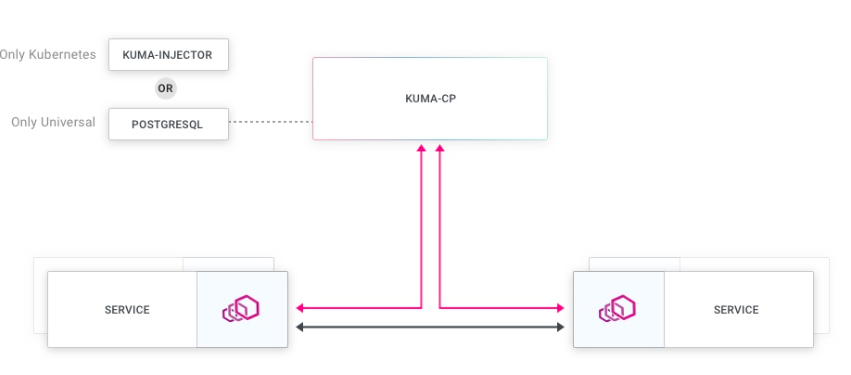
Kuma supports both universal as well as Kubernetes-native infrastructure. Let us understand the architecture for each of the infrastructure modes.
- Kubernetes mode: Kuma uses the Kubernetes API server as the data store to manage policies and configurations. In the
kuma-cp, the sidecar injection is enabled to include service in the mesh. - Universal mode: Kuma service mesh can be enabled via the Kuma API. PostgreSQL serves as the data store for the control plane.
For any other infrastructure other than Kubernetes, refer to Kuma’s official documentation. Let us understand how Kuma works on a Kubernetes-native infrastructure.
How does Kuma Service Mesh work?
The kuma-dp has the sidecar proxy deployed with each service and its replica. It exists on the execution path of all the incoming and outgoing requests to the service. On the contrary, the kuma-cp configures the proxies but does not sit on the execution path of the services.
The Kuma control plane is set up first using the kumactl CLI tool. Kuma supports both deployment topologies, standalone as well as multizone architecture or a hybrid of these. So based on the topology you have, you can use kumactl to create a control plane.
The control plane deployment has the kuma-cp executable running. Once the control plane is up and running, the kuma-injector can be enabled in all the Kubernetes resources by updating the namespaces. Once namespaces are updated and the application deployment starts, Kuma initiates the pod.
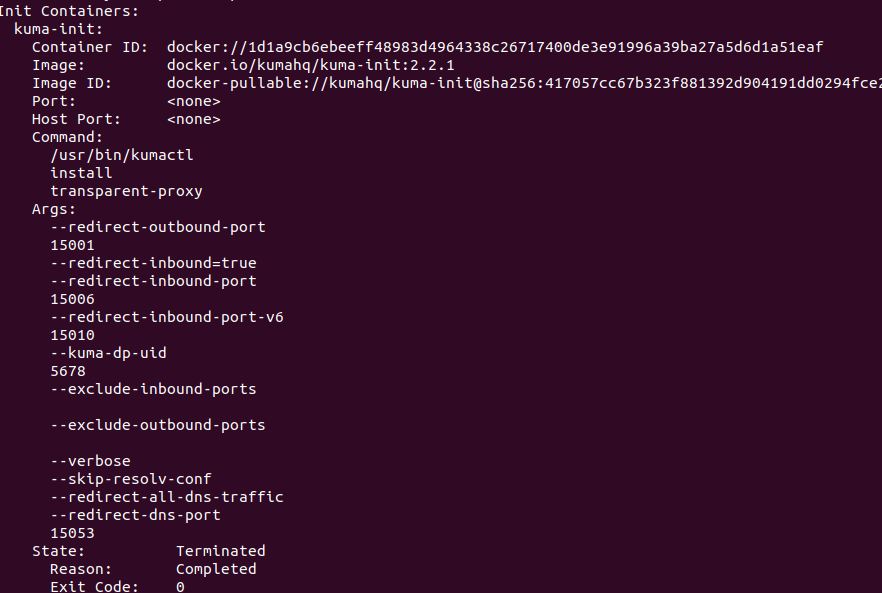
During each pod initialization, kuma-init sets up default transparent proxying to allow traffic only via proxy with predefined ports. This kuma-init container terminates on successful execution with Exit Code 0.
Kuma also provides a plugin called the Kuma CNI plugin that can be manually configured to enable proxying. We have used the default kuma-init in this blog for setup. Here is a snippet showing the successful execution of the kuma-init container for the carts service. You can simply describe the pod to view the init container details.
The application and kuma-sidecar containers come up once the pre-sidecar initialization is complete. The kuma-dp executable runs on each sidecar to the service. The kuma-dp initializes the envoy binary which connects the data plane with the control plane. The control plane then provides the real-time configurations and policies to the data plane.
It is the task of the data plane proxy to enforce them on the service-to-service communication in the network. With this, all the connectivity, security, and routing activities are easily handled by the proxy. To securely allow the outside traffic inside the mesh, Kuma provides the ability to enable a gateway for network traffic proxying. You can refer to the configuration from the Kuma Gateway.
How to implement a Service Mesh with Kuma?
Let us see how we can enable service mesh for a microservice application running on the Kubernetes cluster and understand the benefits of its features.
Pre-requisites
- Kubernetes cluster: We are using Minikube
- Microservice-based application: the sock shop
In order to ensure your application does not have any compatibility issues, you can refer to the Kuma requirements.
How to set up Kuma?
For setting up the control plane and the data plane, Kuma provides a demo application that you can make use of. Here is the overview of the deployment steps:
- Select the deployment topology based on your infrastructure: standalone or multizone. We are using a standalone deployment topology.
- Install kumactl. Please note when we worked on this blog, the latest version of Kuma was 2.2.x.
- Install control plane using kumactl. When topology mode is not passed with kumactl, Kuma will start standalone mode by default. For multizone deployment, set –mode=global
- Enable automatic sidecar injection by adding the label to the application’s pod or namespace as
kuma.io/sidecar-injection: enabledto configure the data plane proxy. Apply the namespace changes and then apply all the other manifests in the namespace to kickstart initialization.
With this, the Kuma service mesh will be configured and any new resource when deployed in the cluster’s namespace will have the sidecar automatically injected. Let us see this with the help of the sock shop application.
Deploy The Sock Shop
-
Use the following commands to clone the repo:
git clone https://github.com/microservices-demo/microservices-demo -
Enable automatic sidecar injection by adding the label to the namespace manifest.
cat deploy/kubernetes/manifests/00-sock-shop-ns.yaml apiVersion: v1 kind: Namespace metadata: name: sock-shop labels: kuma.io/sidecar-injection: enabled -
Create a control plane for standalone deployment topology using
kumactl.kumactl install control-plane | kubectl apply -f - -
Deploy the application by first creating the namespace.
kubectl create -f deploy/kubernetes/manifests/00-sock-shop-ns.yaml -f deploy/kubernetes/manifests -
Verify deployment
$ kubectl get pods -A
NAMESPACE     NAME                                  READY   STATUS    RESTARTS      AGE
kube-system   coredns-565d847f94-57xkh              1/1     Running   1 (42m ago)   24h
kube-system   etcd-minikube                         1/1     Running   1 (42m ago)   24h
kube-system   kube-apiserver-minikube               1/1     Running   1 (42m ago)   24h
kube-system   kube-controller-manager-minikube      1/1     Running   1 (42m ago)   24h
kube-system   kube-proxy-j4rhb                      1/1     Running   1 (42m ago)   24h
kube-system   kube-scheduler-minikube               1/1     Running   1 (42m ago)   24h
kube-system   storage-provisioner                   1/1     Running   2 (41m ago)   24h
kuma-system   kuma-control-plane-67dd5d9496-d8jxw   1/1     Running   0               19m
sock-shop     carts-78d7c69cb8-d6872                2/2     Running   0               9m40s
sock-shop     carts-db-66c4569f54-pk5k9             2/2     Running   0               9m40s
sock-shop     catalogue-7dc9464f59-tdgkj            2/2     Running   0               9m40s
sock-shop     catalogue-db-669d5dbf48-m966d         2/2     Running   0               9m40s
sock-shop     front-end-7d89d49d6b-8kpsp            2/2     Running   0               9m40s
sock-shop     orders-6697b9d66d-htfqq               2/2     Running   0               9m40s
sock-shop     orders-db-7fd77d9556-swl5b            2/2     Running   0               9m40s
sock-shop     payment-ff86cd6f8-zxgxc               2/2     Running   0               9m40s
sock-shop     queue-master-747c9f9cf9-mr7cp         2/2     Running   0               9m40s
sock-shop     rabbitmq-6c7dfd98f6-5ptmp             3/3     Running   0               9m40s
sock-shop     session-db-6747f74f56-pr5mm           2/2     Running   0               9m40s
sock-shop     shipping-74586cc59d-td7cp             2/2     Running   0               9m40s
sock-shop     user-5b695f9cbd-tl8s5                 2/2     Running   0               9m40s
sock-shop     user-db-bcc86b99d-wr5c6               2/2     Running   0               9m40s
Hurray!! The application is deployed successfully. We can see here two new namespaces.
- kuma-system: The Kuma control plane pod is running in this namespace.
- sock-shop: The application’s pod has 2 or 3 containers in this namespace. Kuma creates a sidecar container in each pod after the automatic sidecar injection is enabled.
-
Verify application
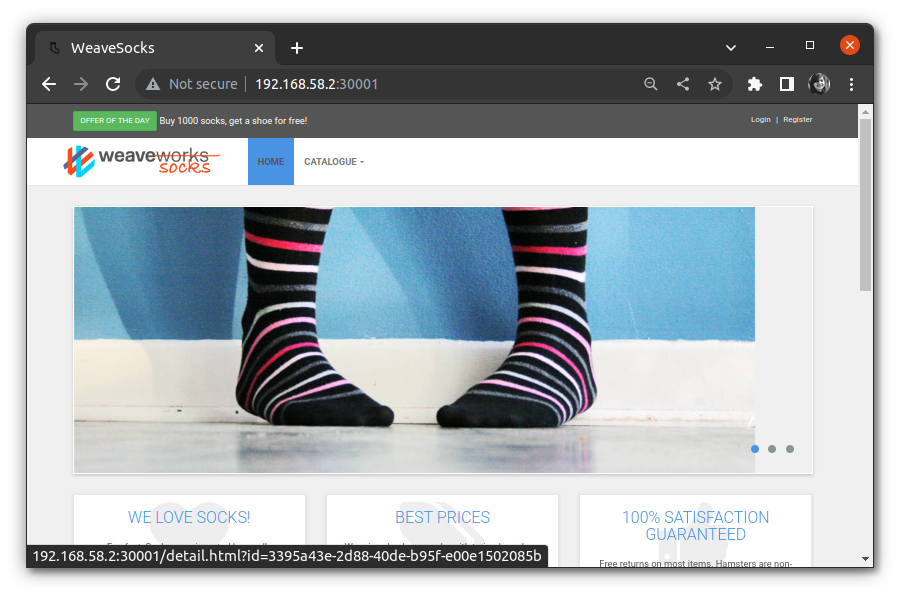
To verify if the application is running, let us access the front-end service using the IP address provided. For minikube, we’ll use a minikube tunnel to enable access to the application. Get the URL using the following command.
$ minikube service list | grep front-end
| sock-shop   | front-end          |           80 | http://192.168.58.2:30001 |
Now navigate the URL provided: http://192.168.58.2:30001
-
Verify service mesh Kuma provides a GUI that helps in viewing the Kuma resources. To access the GUI, we need to first port-forward the API service with:
kubectl port-forward svc/kuma-control-plane -n kuma-system 5681:5681And then navigate to http://127.0.0.1:5681/gui
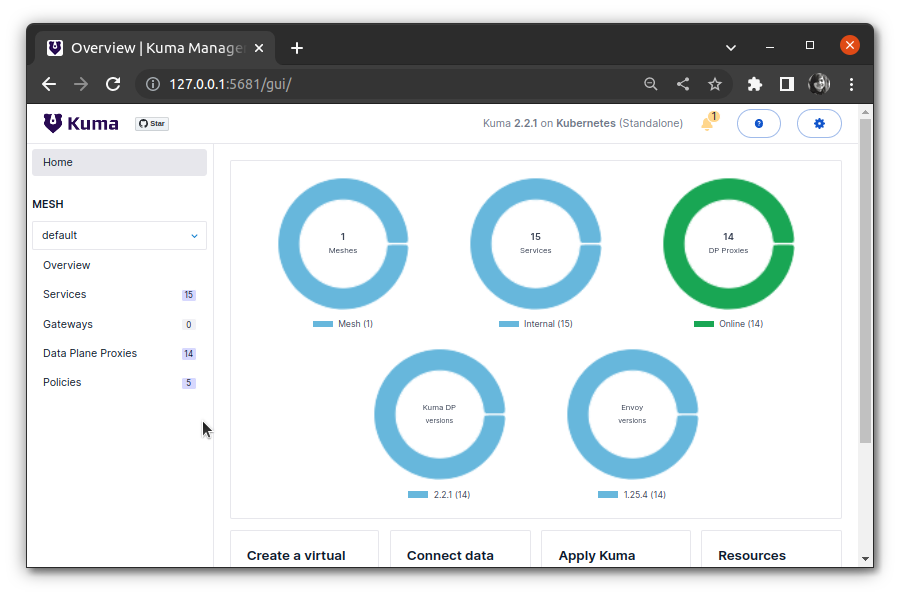
If we click on Policies, we will see that Kuma has already enabled policies like CircuitBreaker, TrafficPermissions, TrafficRoute, Timeout, and Retry by default. We can view the data plane proxies for each service, its status, and the policies enabled. Currently, we see no default gateway is set up thus gateway count is 0. In the coming sections, we will explore some features of Kuma that help make the application more robust and also enable security at the entrance of the mesh using Kuma Gateway.
Kuma Gateway
For the services that need to receive traffic from the external network, Kuma Gateway routes those requests inside the mesh for the service to accept it via the proxy. In order to do that, Kuma sets up a pod dedicated to the gateway once configured. Kuma supports two types of gateway:
- delegated: It allows the user to use any existing gateway like Kong.
- builtin: It requires configuring the DPP to expose external listeners to drive traffic inside the mesh.
You can understand the comparison between delegated and builtin from the documentation.
We are going to create and configure the gateway with builtin type that listens for the traffic from the outside of mesh and forwards it to the sock-shop front-end. Here are the 3 things that we need to set up:
-
MeshGatewayInstance: Kuma comes with a built-in typeMesGatewayInstancethat manages and deploys the proxy to serve gateway traffic. Here is the configuration:apiVersion: kuma.io/v1alpha1 kind: MeshGatewayInstance metadata: name: sock-shop-gateway namespace: sock-shop spec: replicas: 1 serviceType: LoadBalancer tags: kuma.io/service: sock-shop_gatewayIn this configuration, we have defined to setup an instance of the specified kind with 1 replica and load balancer type. With the instance configured, we need to enable listeners for the gateway.
-
MeshGateway: This helps us configure the listeners. Here is the configuration:apiVersion: kuma.io/v1alpha1 kind: MeshGateway mesh: default metadata: name: sock-shop spec: conf: listeners: - port: 80 protocol: HTTP selectors: - match: kuma.io/service: sock-shop_gatewayIn this configuration, we have defined the port and protocol for the gateway. Now we need to define the routes.
-
MeshGatewayRoute: This is used to define the destination route to route incoming traffic from the listener to other services.
apiVersion: kuma.io/v1alpha1
kind: MeshGatewayRoute
mesh: default
metadata:
  name: sock-shop
spec:
  conf:
  http:
    rules:
    - matches:
      - path:
          match: PREFIX
          value: /
      backends:
      - destination:
          kuma.io/service: front-end_sock-shop_svc_80
        weight: 1
  selectors:
  - match:
      kuma.io/service: sock-shop_gateway
Here we have defined the backend destination as the front-end service for the prefix match at
/. Weight is the proportion of requests this backend will receive when a forwarding rule specifies multiple backends. We have set it to 1. Also, the listener is set to sock-shop_gateway to identify incoming requests.
We have kept all three above-defined configurations in the same file. Once this is applied, Kuma will launch a create and configure a builtin type gateway that will route the incoming requests on / to the front-end service.
Let us go ahead and apply the gateway configurations.
$ kubectl apply -f gateway.yaml
meshgateway.kuma.io/sock-shop created
meshgatewayroute.kuma.io/sock-shop created
meshgatewayinstance.kuma.io/sock-shop-gateway created
Verify if the pod is up:
$ kubectl get pods -A | grep gateway
sock-shop     sock-shop-gateway-84f7fb5687-phsvl    1/1     Running   0               2m
As we can see, the pod is running. Let us get the IP of the gateway to send the external traffic to the service:
$ minikube service list | grep gateway
| sock-shop   | sock-shop-gateway  | 80/80        | http://192.168.49.2:30526 |
Finally, let’s verify in the browser:
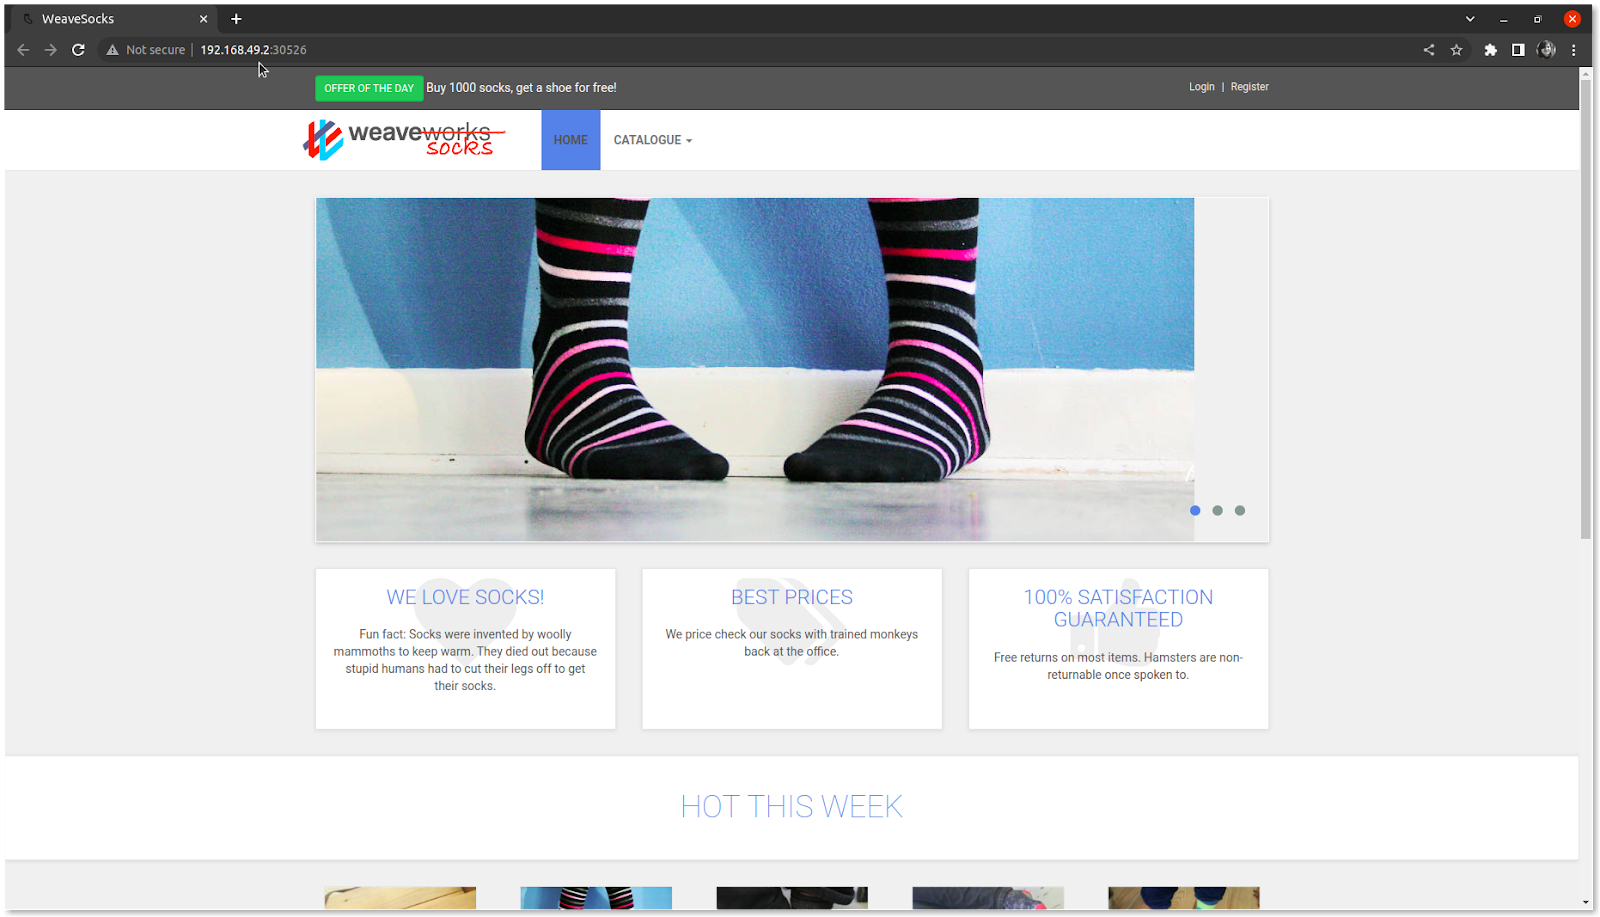
The application is accessible via the gateway. This is how you can easily set up a gateway for your application using Kuma’s built-in gateway.
In the coming section, we will be discussing policies that can be enabled in Kuma. Kuma Gateway provides the policy support for some of the policies on the builtin gateway.
Policy features of Kuma
Kuma provides policies that are combined with the data plane configuration to generate the proxy configuration.
Mutual TLS
The communication across services is not encrypted by default in the Kuma service mesh. Mutual TLS policy helps to encrypt traffic for all the services in a mesh and assign an identity to every data plane. Kuma supports both builtin and provided CA backends.
Before enabling, let us check if plain text traffic which is not encrypted is allowed by accessing the front-end service from the catalogue service’s proxy servers using the following command.
kubectl exec $(kubectl get pod -l name=catalogue -n sock-shop -o jsonpath={.items..metadata.name}) -c kuma-sidecar -n sock-shop -- wget --spider -S http://front-end/
Connecting to front-end (10.102.50.169:80)
  HTTP/1.1 200 OK
  X-Powered-By: Express
  Accept-Ranges: bytes
  Cache-Control: public, max-age=0
  Last-Modified: Tue, 21 Mar 2017 11:31:47 GMT
  ETag: W/"21f0-15af0a320b8"
  Content-Type: text/html; charset=UTF-8
  Content-Length: 8688
  Date: Thu, 22 Jun 2023 11:59:52 GMT
  Connection: close
  remote file exists
When mTLS is enabled, all traffic is denied unless a TrafficPermission policy is configured to explicitly allow traffic across proxies with encryption. So we need to verify that the TrafficPermission policy is enabled. In the Kuma service mesh, this policy is enabled by default.
$ kumactl get traffic-permissions
MESH      NAME                AGE
default   allow-all-default   2h
Use the following yaml to enable mTLS with a built-in backend.
apiVersion: kuma.io/v1alpha1
kind: Mesh
metadata:
  name: default
spec:
  mtls:
    enabledBackend: ca-1
    backends:
      - name: ca-1
        type: builtin
        dpCert:
          rotation:
            expiration: 1d
        conf:
          caCert:
            RSAbits: 2048
            expiration: 10y
Kuma assigns a certificate to each data plane proxy. We have set the value as 1 day for the data plane cert expiration so that the cert gets rotated every day.
Apply this configuration:
$ kubectl apply -f mtls.yaml
mesh.kuma.io/default configured
Verify using the same command that we executed before enabling mTLS:
kubectl exec $(kubectl get pod -l name=catalogue -n sock-shop -o jsonpath={.items..metadata.name}) -c kuma-sidecar -n sock-shop -- wget --spider -S http://front-end/
Connecting to front-end (10.102.50.169:80)
wget: error getting response: Resource temporarily unavailable
command terminated with exit code 1
This is how with Kuma you can implement zero trust security in an automated way for all data plane proxies and secure all your services within the mesh.
Rate limiting
By default, there is no limit on the inbound traffic. Using this policy, a limit can be imposed on the service on how many requests are allowed in a specified time period and the response when the threshold is reached.
From Kuma’s doc, All HTTP/HTTP2 based requests are supported. So we need to ensure that the app supports the HTTP-based requests. You can set appProtocol as HTTP for the application deployment to allow HTTP requests. You can verify it from Kuma’s dashboard.

Use the following yaml to enable the rate limit from all services to the front-end service.
apiVersion: kuma.io/v1alpha1
kind: RateLimit
mesh: default
metadata:
  name: rate-limit-to-front-end
spec:
  sources:
    - match:
        kuma.io/service: '*'
  destinations:
    - match:
        kuma.io/service: 'front-end_sock-shop_svc_80'
  conf:
    http:
      requests: 1
      interval: 60s
      onRateLimit:
        status: 423
        headers:
          - key: "x-kuma-rate-limited"
            value: "true"
            append: true
We have added conf for HTTP-based requests to allow only 1 request to be processed by the front-end service in the duration of 60s intervals from all the services. Once the threshold is reached, the app will return the 423 status code and header as mentioned.
Before applying let us verify by making 2 requests in less than 60 secs from any of the service containers. We have logged in to the catalogue service container and sent an HTTP request to the front-end service.
$ kubectl -n sock-shop exec -it catalogue-7dc9464f59-tdgkj -- sh
/ $ wget http://front-end
Connecting to front-end (10.102.50.169:80)
wget: can't open 'index.html': Read-only file system
/ $ wget http://front-end
Connecting to front-end (10.102.50.169:80)
wget: can't open 'index.html': Read-only file system
Apply the configuration:
$ kubectl apply -f rate-limit.yaml
ratelimit.kuma.io/rate-limit-to-front-end created
Verify with kumactl:
$ kumactl get rate-limits
MESH      NAME                      AGE
default   rate-limit-to-front-end   4m
Rate limit in action: Let us go and make 2 requests again from the catalogue container within 60 seconds.
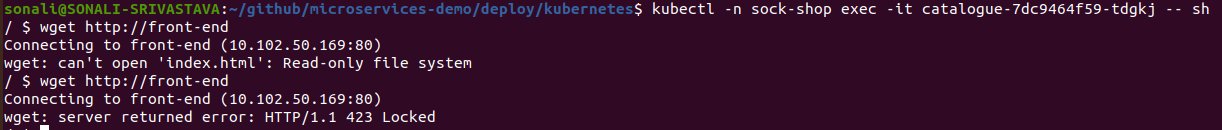
If we look carefully at the above outputs, we can see that the first time the request was served successfully but the second time server returned an error with status code 423. This means that the rate limit is working as expected. This is how you can enable rate-limiting using Kuma.
Circuit Breaker
Instead of additional traffic, Kuma inspects existing live service traffic that is being exchanged between data plane proxies and marks unhealthy proxies based on detectors. Kuma makes use of detectors for deviation detection. Detectors include the conditions based on which Kuma decides when to open or close a circuit breaker.
In this policy, there are 5 types of detectors that can all be enabled at a time. Once any one of them is triggered because of deviations, no additional traffic can reach that service avoiding cascade failure. The duration is decided based on the value of baseEjectionTime which defaults to 30 seconds. The default circuit breaker policy is enabled by Kuma when you inject the sidecar.
You can view the existing circuit breakers using the following command:
$ kumactl get circuit-breakers -o json
For production deployments, it is advised to enable circuit breakers with detectors. We are going to enable a total error detector. Total errors help to identify the count of consecutive 5xx and locally generated errors. The default value is 5 for it.
Use the following yaml file to enable total errors and gateway errors detector with default values for the front-end service.
apiVersion: kuma.io/v1alpha1
kind: CircuitBreaker
mesh: default
metadata:
  name: circuit-breaker-example
spec:
  sources:
  - match:
      kuma.io/service: "*"
  destinations:
  - match:
      kuma.io/service: front-end_sock-shop_svc_80
  conf:
    interval: 5s
    baseEjectionTime: 30s
    maxEjectionPercent: 20
    splitExternalAndLocalErrors: false
    thresholds:
      maxConnections: 2
      maxPendingRequests: 2
      maxRequests: 2
      maxRetries: 2
    detectors:
      totalErrors:
        consecutive: 2
Once the detectors are enabled, any deviation will trigger the detectors. We have set the value for the maxConnections as 2 so if more than 2 parallel connection requests hit the frontend service, it will trip the circuit breaker. Also for the total errors, we have set the consecutive as 2. So any 2 consecutive 5xx errors will trip the circuit breaker. Once the circuit breaker is tripped, it marks the front-end DPP as unhealthy and will eject it for 30 seconds based on the baseEjectionTime value. Thus the service will be unavailable. Since the circuit breaker policy does not send additional traffic to check DPP health, it will make use of the live traffic. In every 5s interval it will check for the policy again. This is how Kuma avoids cascade failure. CircuitBreaker resources list can help you understand the details of each field.
Apply the configuration:
$ kubectl apply -f circuit-breaker.y
circuitbreaker.kuma.io/circuit-breaker-example created
Circuit breaker policy is successfully enabled with detectors in Kuma. Let us see the circuit breaker in action by tripping it. Here we have tripped the circuit breaker by sending 10 connection requests at a time to the service. Since the Kuma Gateway provides full support for the policy, let us hit the gateway IP.
$ seq 1 10 | xargs -n1 -P10 curl -I "http://192.168.49.2:30526"
HTTP/1.1 200 OK
x-powered-by: Express
accept-ranges: bytes
cache-control: public, max-age=0
last-modified: Tue, 21 Mar 2017 11:31:47 GMT
etag: W/"21f0-15af0a320b8"
content-type: text/html; charset=UTF-8
content-length: 8688
date: Wed, 28 Jun 2023 11:02:07 GMT
x-envoy-upstream-service-time: 1
server: Kuma Gateway

HTTP/1.1 503 Service Unavailable
x-envoy-overloaded: true
content-length: 81
content-type: text/plain
vary: Accept-Encoding
date: Wed, 28 Jun 2023 11:02:07 GMT
server: Kuma Gateway
If we look at the output above, we can see first two requests were served and then we received 503 service-unavailable responses. This is how you can enable circuit breakers in Kuma and avoid cascade failure. The values of the errors can be adjusted as per your application’s requirements. You can refer to the policy field details of all the detectors, and their default values and can set accordingly.
Traffic Route
With the traffic route policy, you can enable L4 traffic routing using Kuma. This makes it easier to implement blue/green deployments and canary releases. This policy is enabled by default with a load balancer. The policy is applied to all the data planes in the mesh. You can view the policy manifest using the following command.
$ kumactl get traffic-routes -o json
In the default traffic route policy, Kuma uses a tag assigned to the service to apply the traffic route to all services. The routing is done in the round-robin way mentioned in the loadBalancer.
For L4 traffic split over two versions of the application, you can update the conf with weight and the destination for the matching source. Kuma also supports L7 traffic split, moderation, and rerouting. For more information on the fields to use, you can check the TrafficRoute resources list.
Fault Injection
Only setting up the guardrails is not enough unless we test the microservices against resilience. Fault injection allows us to mimic errors or faults in the infrastructure. This policy is available only for L7 HTTP traffic so we need to ensure that the destination for which we need to inject fault should have http, http2, or grpc protocol support. You can check the rate-limit section to ensure HTTP protocol support.
Kuma provides 3 HTTP faults that can be imitated:
-
Abort: When abort is injected, it returns a percentage of requests with only a pre-defined status code. So those are the two things you need to set.
status code: HTTP status code that will be sent as a response to any request to the destination.percentage: of requests on which abort will be injected. Values are allowed from 0-100.
-
ResponseBandwidth limit: With this fault injected, a limit is set to the speed of responding to the request for a percentage of requests. Here are the two things you need to set:
limit: speed of responding in gbps, mbps, kbps, or bps.percentage: of requests on whichresponseBandwidthfault will be injected. Values are allowed from 0-100.
-
Delay: With delay injected, the response will be delayed for the defined duration for a percentage of requests. Here are the two things you need to set.
- value: duration for which response will be delayed
percentage: of requests on which delay will be injected. Values are allowed from 0-100.
Use the following yaml to enable fault injection policy with abort fault:
apiVersion: kuma.io/v1alpha1
kind: FaultInjection
mesh: default
metadata:
  name: fi1
spec:
  sources:
    - match:
        kuma.io/service: '*'
        kuma.io/protocol: http
  destinations:
    - match:
        kuma.io/service: front-end_sock-shop_svc_80
        kuma.io/protocol: http
  conf:
    abort:
      httpStatus: 500
      percentage: 100
Here we have injected abort fault for all the requests by setting the percentage to 100 in case the request is sent to the front-end service from any source over HTTP protocol. The response status code will be 500.
Let us go and make a request to front-end service before enabling the fault injection policy to see what response are we getting.
$ kubectl -n sock-shop exec front-end-7d89d49d6b-8kpsp  -it  -- sh
/usr/src/app $ wget http://front-end
Connecting to front-end (10.102.50.169:80)
wget: can't open 'index.html': Read-only file system
So it is able to connect successfully.
Let us now enable the policy.
$ kubectl apply -f fi.yaml
faultinjection.kuma.io/fi1 created
Verify with kumactl:
$ kumactl get fault-injections
MESH      NAME   AGE
default   fi1    3m
Abort fault injection in action:
$ kubectl -n sock-shop exec front-end-7d89d49d6b-8kpsp  -it  -- sh
/usr/src/app $ wget http://front-end
Connecting to front-end (10.102.50.169:80)
wget: server returned error: HTTP/1.1 500 Internal Server Error
We can see in the above output that the response is 500. It is the same as what we have set in the configuration.
This is how you can inject more errors in your microservice application and test it against resiliency.
These are just a few policies that we have enabled and shown from a beginner’s perspective. For the production-grade setup, you can configure more policies like fault injection, retry, timeout, etc. using Kuma. From version 2.0, Kuma has started beta support for targetref policies. For each source-destination policy, there is an equivalent targetref policy. The major reason to initiate the transition is the challenges with existing S&D, which makes it complex to implement.
With policies enabled, the application can be more robust without actually making any changes to the application codebase. Let us now understand how we can have monitored over a Kuma service mesh.
Observability features of Kuma: Monitoring Service Mesh
Kuma provides a built-in observability stack that helps with monitoring the service mesh. It comes with a package that can be used to enable components like metrics, logs, and traces using kumactl. Use the following command.
$ kumactl install observability | kubectl apply -f -
On successful execution, Kuma creates a namespace mesh-observability
 $ kubectl get ns | grep observability
mesh-observability   Active   19s
The namespace spins up the following pods which can be used for monitoring traffic.
$ kubectl get svc -n mesh-observability
NAME                            TYPE        CLUSTER-IP       EXTERNAL-IP   PORT(S)                                          AGE
grafana                         ClusterIP   10.100.220.39    <none>        80/TCP                                           9m
jaeger-agent                    ClusterIP   None             <none>        5775/UDP,6831/UDP,6832/UDP,5778/TCP              9m
jaeger-collector                ClusterIP   10.104.6.217     <none>        14267/TCP,14268/TCP,9411/TCP,4317/TCP,4318/TCP   9m
jaeger-query                    ClusterIP   10.111.72.152    <none>        80/TCP                                           9m
loki                            ClusterIP   10.96.109.104    <none>        3100/TCP                                         9m
loki-headless                   ClusterIP   None             <none>        3100/TCP                                         9m
prometheus-kube-state-metrics   ClusterIP   None             <none>        80/TCP,81/TCP                                    9m
prometheus-server               ClusterIP   10.103.244.232   <none>        80/TCP                                           9m
zipkin                          ClusterIP   None             <none>        9411/TCP                                         9m
Kuma provides integration with Prometheus, Grafana, Loki, and Jaeger. In this blog, we will be talking about traffic metrics and traffic trace. You can read more about the traffic logs policy supported by Kuma.
Integration with Prometheus and Grafana
Kuma provides full integration with Prometheus by exposing metrics in Prometheus format and an API to monitor every proxy in the mesh and the application. The collected metrics can be queried and displayed using Grafana. Kuma does a basic installation and setup of Grafana with the observability package that we installed. We need to expose the metrics to enable telemetry.
Use the following yaml to expose metrics from DPP to enable the collection of metrics for all our service mesh traffic:
 apiVersion: kuma.io/v1alpha1
kind: Mesh
metadata:
  name: default
spec:
  metrics:
    enabledBackend: prometheus-1
    backends:
    - name: prometheus-1
      type: prometheus
Using this configuration, we are enabling the prometheus metrics backend on default Mesh Apply this configuration:
$ kubectl apply -f prom.yaml
mesh.kuma.io/default configured
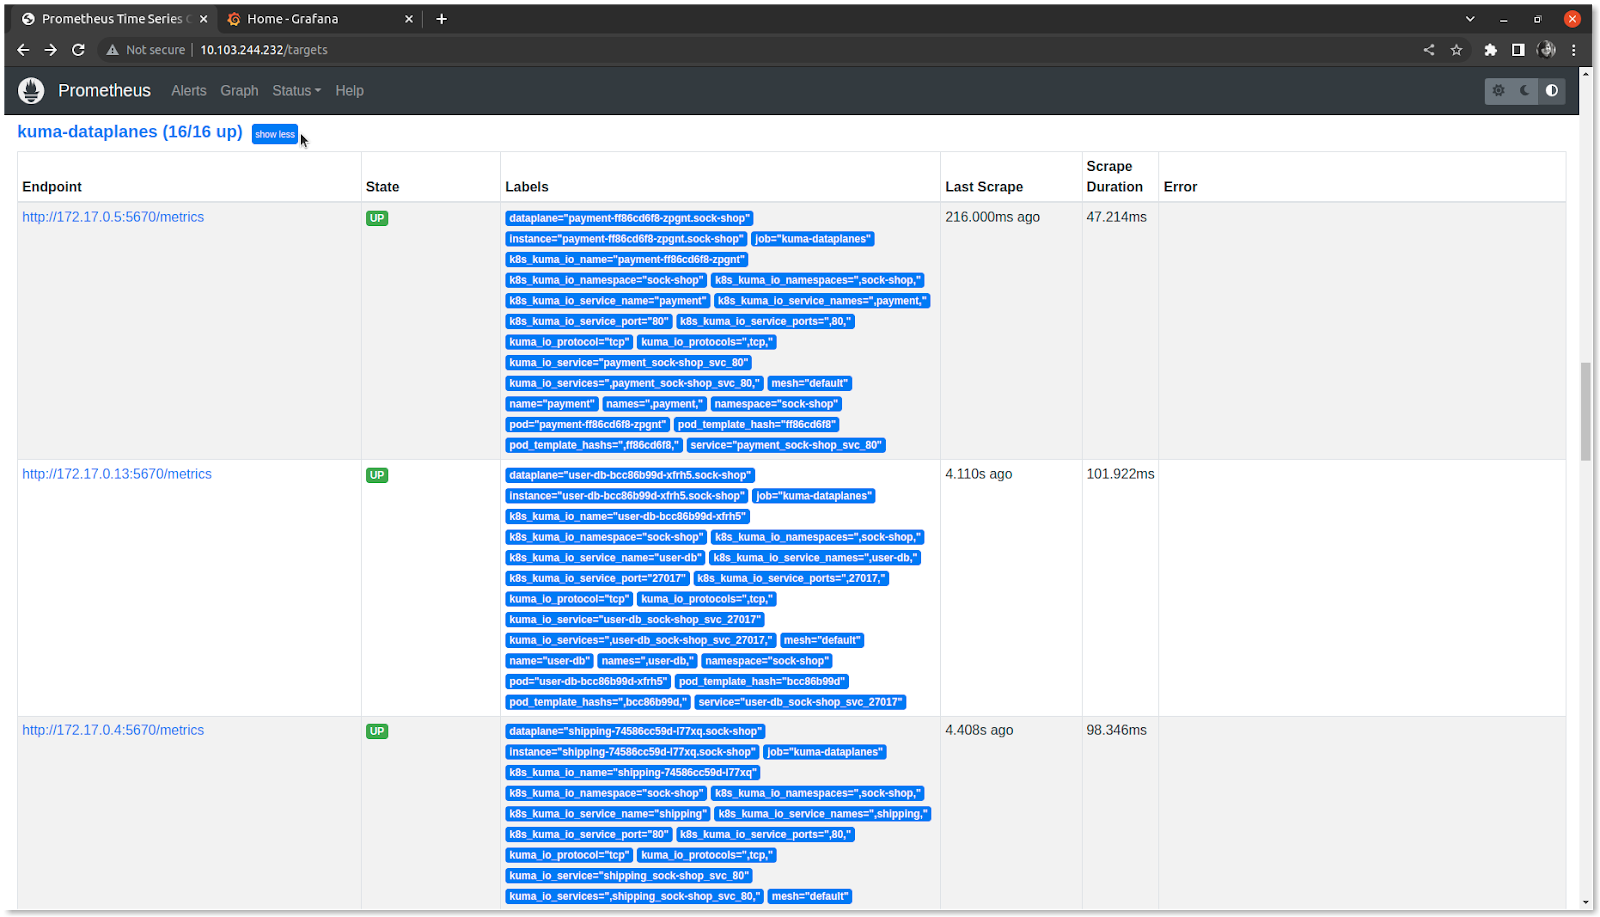
Verify Prometheus dashboard using prometheus-server ClusterIP. Click on ‘Status’ and select ‘targets’ to view the endpoints. In the kuma-dataplanes, you can view the status of each data plane.
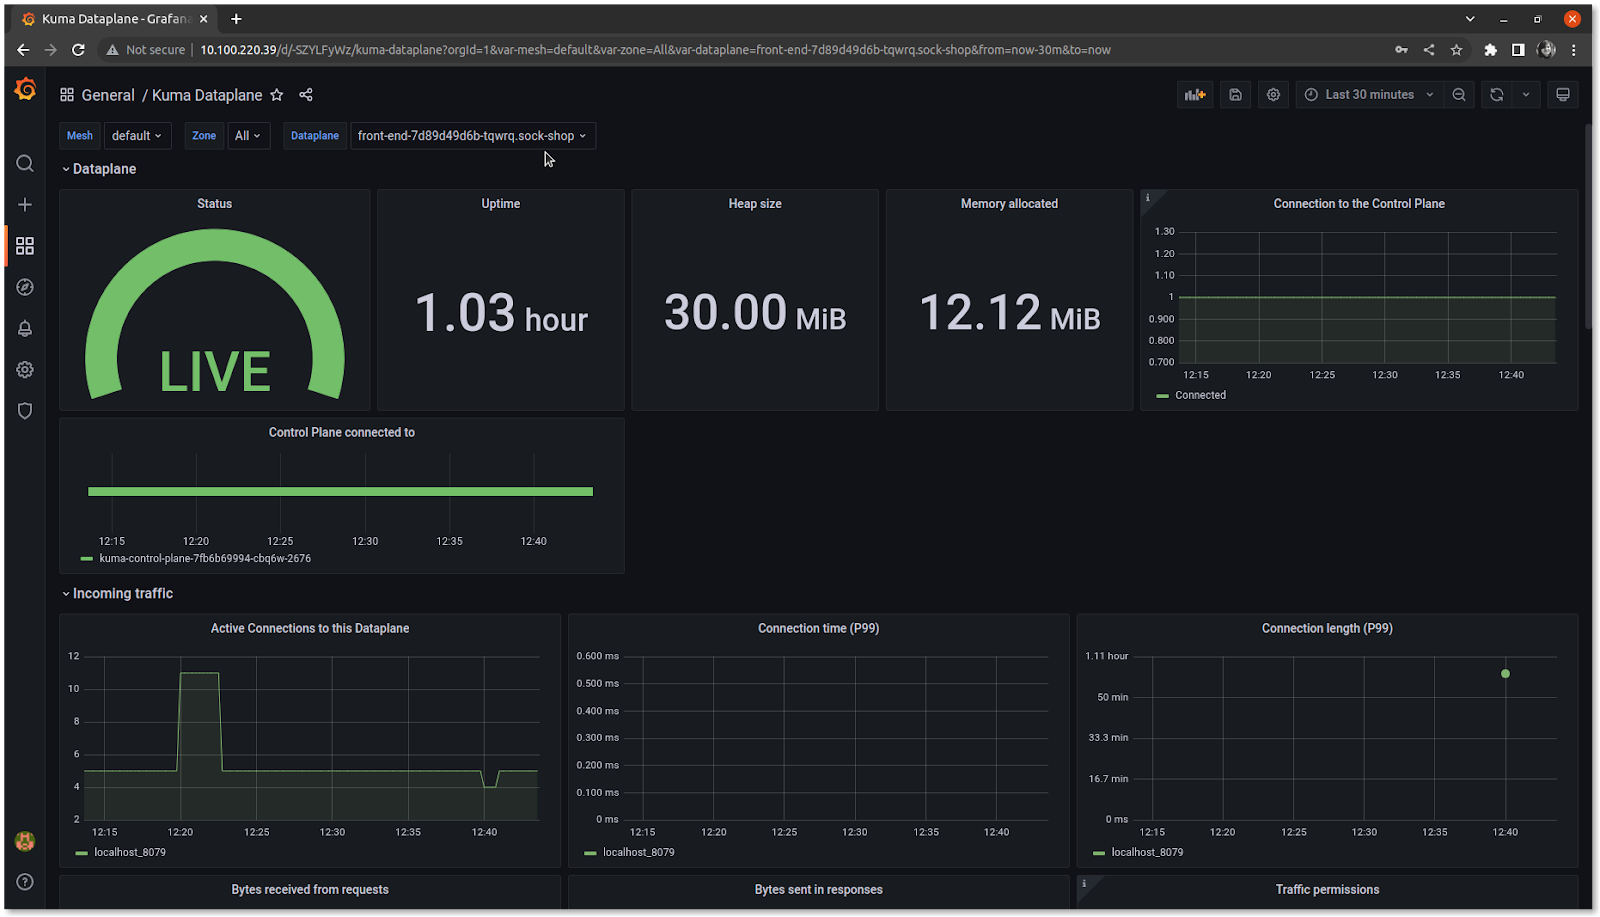
Verify the Grafana dashboard using grafana ClusterIP. Enter the username as admin and password as admin. Configure the Data Sources with Prometheus type. Click on Save and test. Grafana identifies the data source and fetches the metrics. Kuma provides data sources and dashboards as Grafana extensions. We have talked about some of the extensions below:
-
Kuma Dataplane: helps in investigating a single data plane in the mesh. Select Kuma Dataplane in the Dashboards and in the dropdown, select the dataplane you want to view. We have selected the frontend data plane.
-
Kuma CP: This helps to view control plane statistics like the actual status of the service mesh, performance of the service mesh, etc. Select Kuma CP in the Dashboards to view.
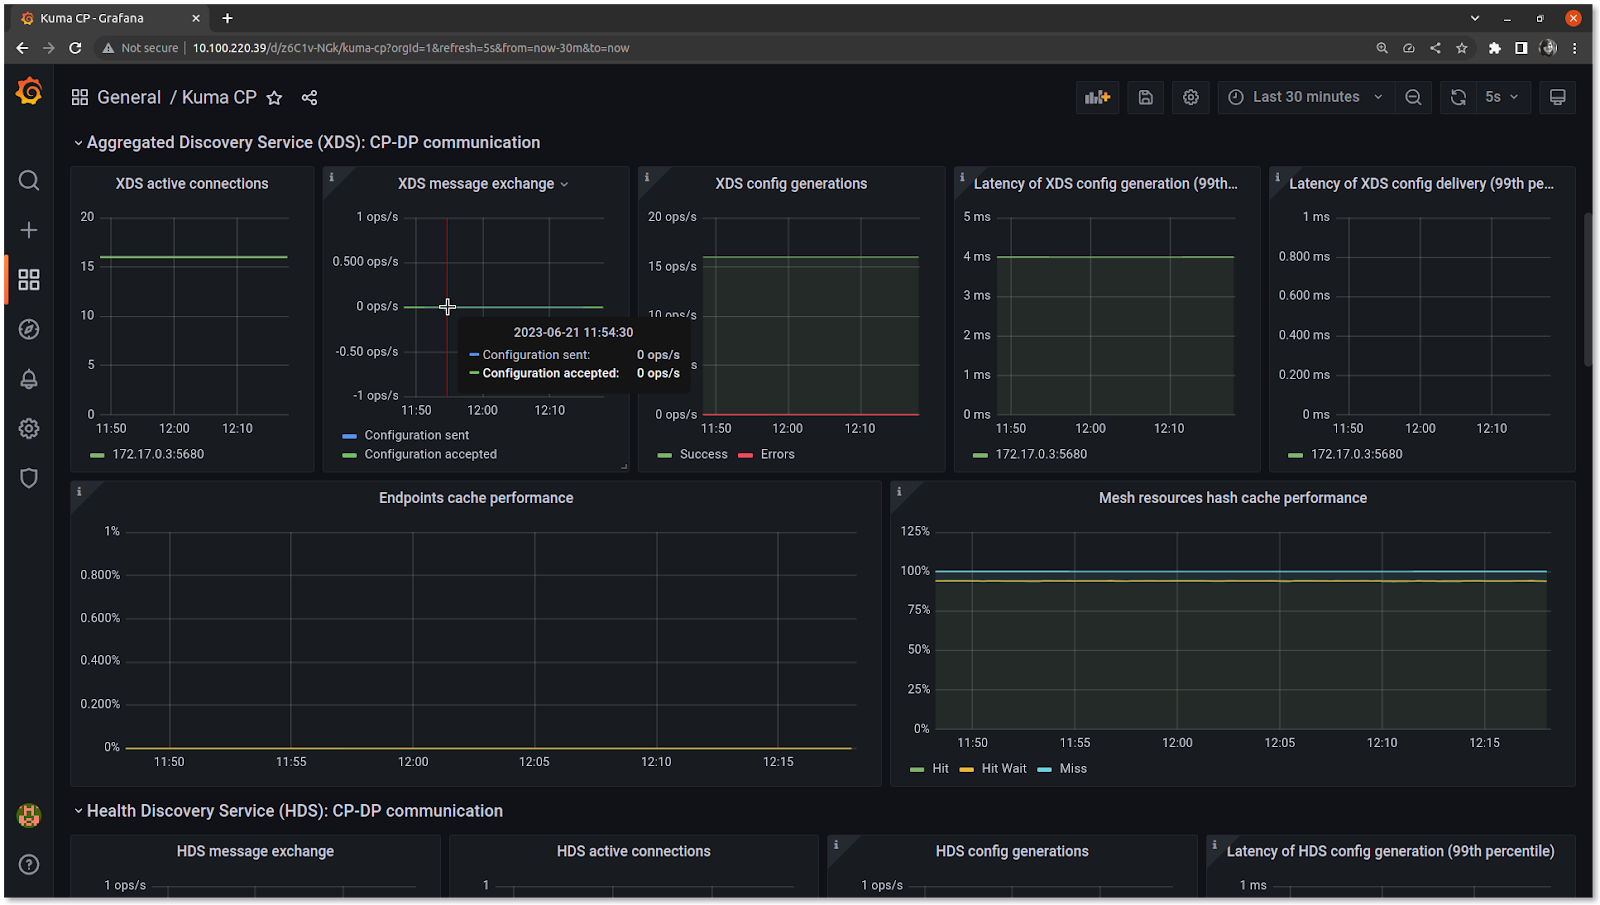
In the above graph, we can see the status of the control plane and data plane communication in terms of aggregated discovery services, health discovery services, etc.
Similarly, you can view the aggregated statistics like the number of requests and error rates using Kuma Mesh and aggregated statistics of Kuma Service to Service.
Integration with Jaeger
Kuma also installs and does Jaeger’s basic setup with the observability package. Using Grafana we can visualize the traces from Jaeger. In Grafana, add Data Sources with Jaeger type and get started with creating dashboards.
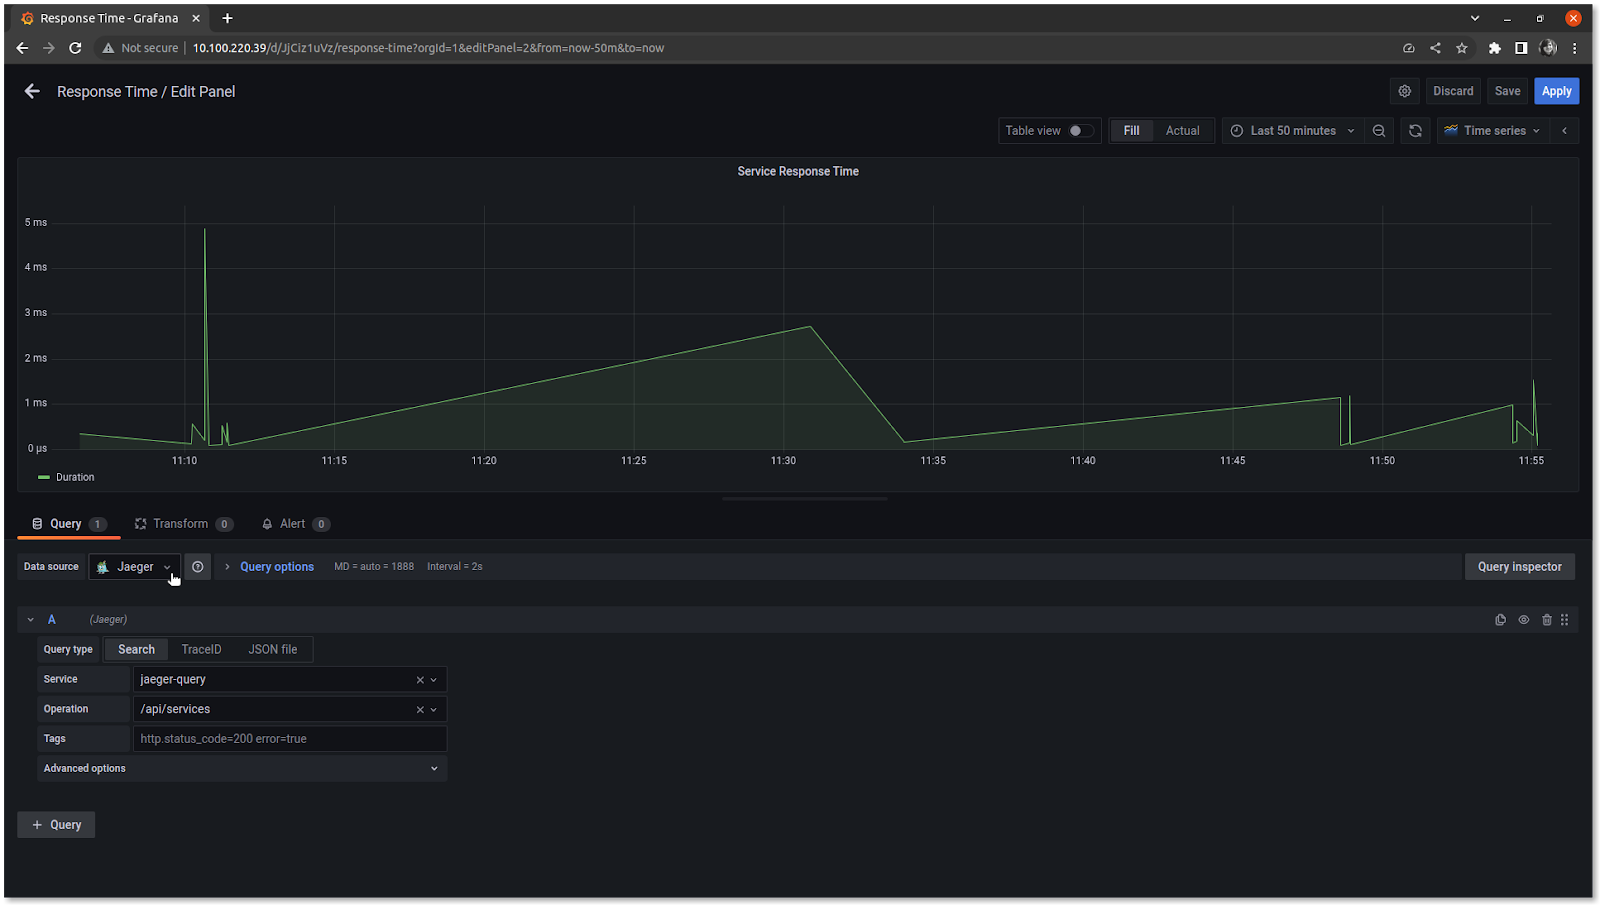
Here we have selected the Jaeger data source and plotted a graph to visualize traces of the response time of each /api/service.
Similarly, we can also enable the metrics collection for the application and monitor the application traffic. With this Kuma makes it easier to enable observability and monitor the service mesh. We agree that this deployment and setup are not production ready but it helps in getting started. We can build on top easily once the basic setup is ready to use. Let us understand some more such benefits of Kuma over other service mesh.
Benefits of Kuma
In this blog, we have seen that with the help of easy-to-understand Kuma documentation, we have been able to set up Kuma, deploy an application, enforce policies that strengthen the network, and enable observability. Service mesh does not have to be complex. Since scalability is directly proportional to operational cost, too many moving parts mean a lack of clarity on how high the operational cost could be. Kuma ships most of the features via policies, provides builtin stack for observability and much more, it becomes easy to implement these features since it does not have too many moving parts.
For organizations that are still transitioning from bare metals to Kubernetes, the infrastructure could be a hybrid of both. Now with Kuma, the service mesh could still be implemented for the complete infrastructure. Also, for the different teams, multiple individual meshes can be configured with a single control plane. Not all these infrastructure components need to be geographically close. With Kuma’s multi-zone support, you can configure service mesh on multiple clouds and regions. The network can be improved by implementing easy-to-setup policies. With other service mesh, it is not so easy to achieve all this using a single solution.
Conclusion
Service mesh helps in strengthening the infrastructure without making any changes to the application. This also helps an organization shape better in terms of developer and platform engineer responsibilities. With the service mesh, there is no denying that the resource utilization increased but there are such service mesh that is easy to deploy, optimize and manage. Our service mesh experts can help you understand and choose the best solution for your production deployments.
Kuma’s easy to setup installer and kumactl CLI tool help to deploy service mesh with policies like a circuit breaker, rate limit, etc that help avoid issues in the runtime and prevent downtimes. Kuma provides observability over service mesh traffic and the application traffic that helps in reduced time to resolve production issues.
We have seen in the blog post how easy it is to get started with Kuma using an e-commerce application. In the case of production-grade deployment, it could be challenging to monitor traffic and gain fine control of the application which can be made easy with the right implementation of policies in Kuma.
I hope you found this post informative and engaging. For more posts like this one, do subscribe to our newsletter for a weekly dose of cloud native. I’d love to hear your thoughts on this post, let’s connect and start a conversation on Twitter or LinkedIn.
References
Stay updated with latest in AI and Cloud Native tech
We hate 😖 spam as much as you do! You're in a safe company.
Only delivering solid AI & cloud native content.
Posts You Might Like