Making Prometheus Highly Available (HA) & Scalable with Thanos

In previous blog posts, we have talked about the basics of autoscaling, autoscaling using custom metrics and Prometheus Operator which covers various aspects of monitoring in Kubernetes. One thing we haven’t talked so much about is the high availability (HA) of Prometheus in the cluster. What if the single Prometheus instance goes down? Or if a single instance can not handle metrics for the whole cluster and you need to scale horizontally?In this post, we will use Thanos to make Prometheus highly available (HA) and scalable. Sounds exciting? Let’s get started!
Quick prometheus tour
Prometheus is installed in a cluster and “scrapes” metrics from the application, but what does “scraping” mean?. The application will expose the metric values at a particular port – let’s say 8080 in the exposition format defined by Prometheus. Prometheus will keep hitting this URL (scrape the URL) at a given interval of time and show these metrics on it’s dashboard. According to the retention time period specified in the configuration, those values will be kept in memory and later will get stored on the disk where Prometheus is running. Based on volume and logical isolation needed for various components, Prometheus can be installed in various topologies.
Prometheus deployment topologies
Prometheus instance per cluster
If a single Prometheus instance is enough to scrape all of your workload, then the easiest solution is to just increase the number of replicas of Prometheus. This means that all the replicas will have the same scrape configuration and all instances will have the same data. In practice, based on interval and data collected, the values will be slightly different but that is not an overall deal breaker and gives higher availability to Prometheus at the cluster level.
Prometheus instance per group of services
If the previous model does not work in your case, then splitting the task between two or three Prometheus instances could be one strategy (which is basically sharding). Each instance will be configured to scrape a group of services instead of scraping all the services. To make these instances highly available we can have scale replicas per instance as per need.
Prometheus instance per service
To split and scale it further, functional sharding is recommended. In this case, we will have one Prometheus instance scraping one service. And again to make this Highly Available (HA) we can have scale replicas for each instance. If more sharding is required then it can be achieved by having separate instances of Prometheus scrapping a set of metrics from a service – but in practice, very few use cases would need to do this in my experience.
What about Alertmanager?
One of the side effects of multiple instances of Prometheus is that the alert manager can get the same alert twice. Prometheus can discover all instances of Alertmanager and fires the alert against all of them. But the alert manager has a cluster with gossip protocol which takes care of deduplicating these alerts. More on this in Prometheus Operator documentation and Prometheus FAQs
How to combine multiple Prometheus instances?
Now that we have multiple instances scraping different parts of our application, how to get a global view of whole data? How to view the graph of data in Grafana, without switching the data sources? One solution is to configure a meta Prometheus instance which will utilize the federation feature of Prometheus and scrape all the instances for some portion of data. In this way, we will have some kind of overview of all the metrics we are scraping. But is this a actual global view? No, we are probably missing a lot of data which is collected by our instances. Also, we have the overhead of configuring this meta Prometheus correctly to have data aggregated.
Data volume!
While we have our instances collecting a huge amount of data and Prometheus’ tsdb supports compression mechanism, we still have limitation over the amount of data we can actually retain, as we will have either use SSD or HDD backed storage for each instance. The costs of these volumes across multiple instances and meta instances can grow quite fast and is not economical beyond a certain scale.
Thanos to the rescue for high availability Prometheus
Thank god, Thanos can solve some of the above problems. Thanos injects a sidecar in every instance of Prometheus, which makes it possible to have real global view of metrics. It can also store the data from Prometheus’ disk to S3 compatible storage. Let’s quicky understand various components that make Thanos work:
- Sidecar
- Works as proxy that serves Prometheus local data to Querier over gRPC based Store API
- This allows Querier to get data based on labels as well as time ranges
- Uploads the data blocks written by Prometheus to S3 storage
- This helps to keep the Prometheus + Sidecar lightweight
- Querier
- Stateless, horizontally scalable
- Works like a Prometheus instance to the outside world; serves same as Prometheus over HTTP API
- Queries the Thanos components and Sidecars for data
- Deduplication and aggregations happens in the Querier
- Requires unique label pair on all Prometheus instances across cluster so that the deduplication will work correctly. i.e. if the replica label is different for a metric then it’s a duplicate
- Store
- Retrieves the data from S3 store
- Participates in gossip cluster and implements Store API
- It’s just like another Sidecar for Querier
- The data blocks on S3 may have several large files. Caching them will also require more storage in Store component. Instead, it tries to align the data and uses an index to minimize the HTTP calls and bandwidth
- Compactor
- Applies Prometheus’ local compaction mechanism to the historical data from the store
- Can be run as a periodic batch job
- Down-samples the data to 5 minutes and 1 hour as well as stores basic query results like min, max, sum, count and the Querier selects the appropriate result from the data
- Ruler
- Evaluates rules and alerts against Thanos Querier to give a global unified view of data
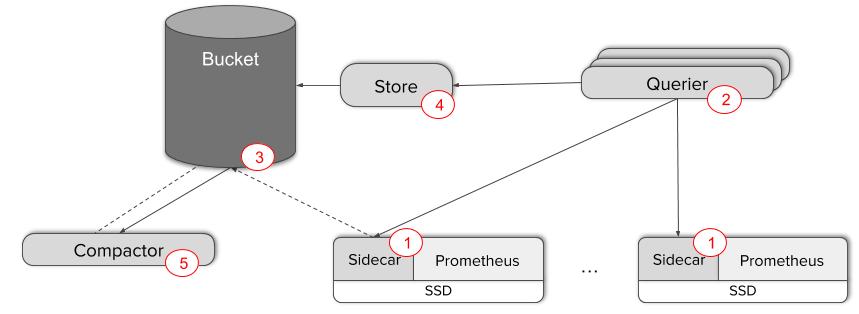
Image credits: Improbable Worlds Ltd
Read more about this in Introducing Thanos: Prometheus at scale by Improbable Worlds
How to deploy Thanos on multi-cluster environment: hands on
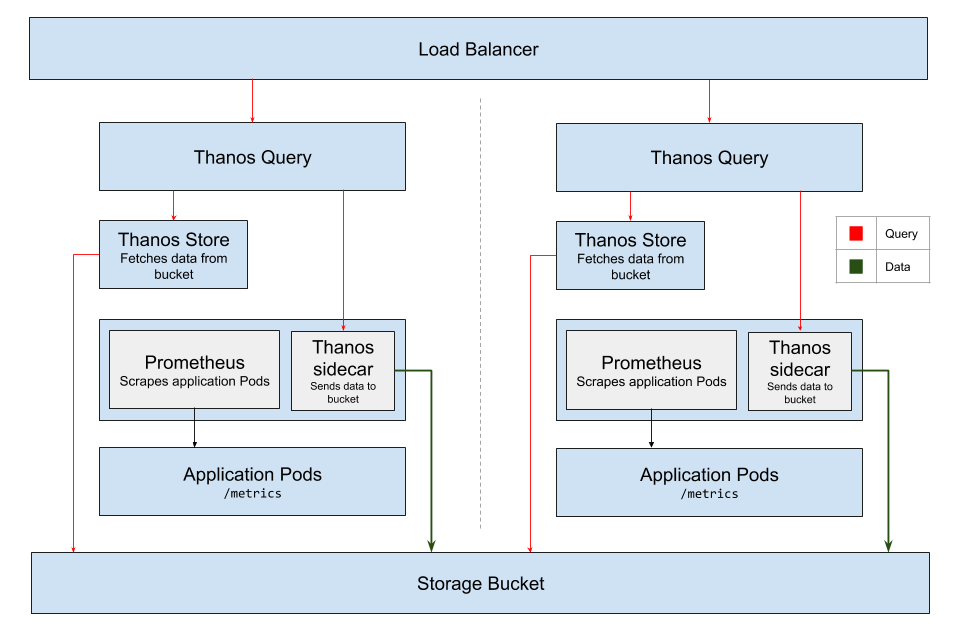
Multi cluster deployment is fairly common for building highly available services. Let’s take a scenario of two clusters deployed in two AZs of regions and Thanos aggregating the data from these two regions. In this case, Thanos makes it really simple to have e global view of data across all the clusters. We can view correctly aggregated graphs as we will be using same S3 compatible storage bucket as a backend.
Let’s create two clusters in different zones and deploy an demo application on top of them. We are using the GKE cluster in this case.
Two clusters we have here are:
bhavin-cluster-1   in   asia-south1-a
bhavin-cluster-2   in   asia-east1-a
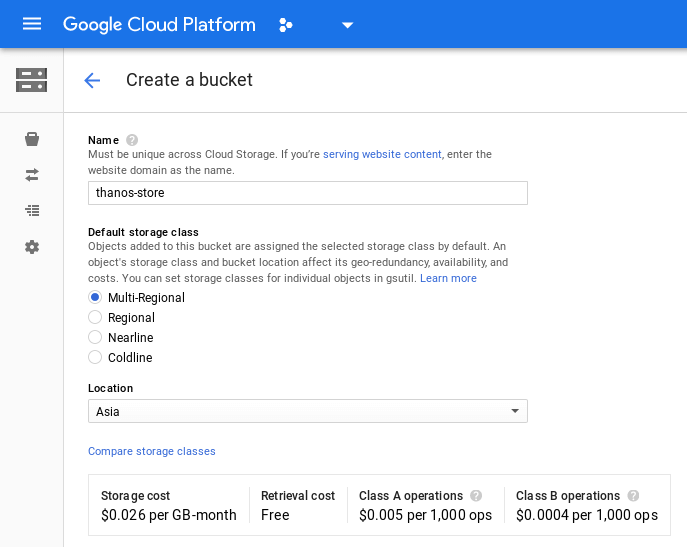
Creating the GCP storage bucket
We will create a bucket ‘thanos-store’, where all the data will get stored. We will also create a Service Account which will grant our Thanos components to store and fetch the metrics data to and from the bucket
- Create a bucket
Storage -> Create bucket
- Add a Service Account with Roles Storage Object Creator and Viewer
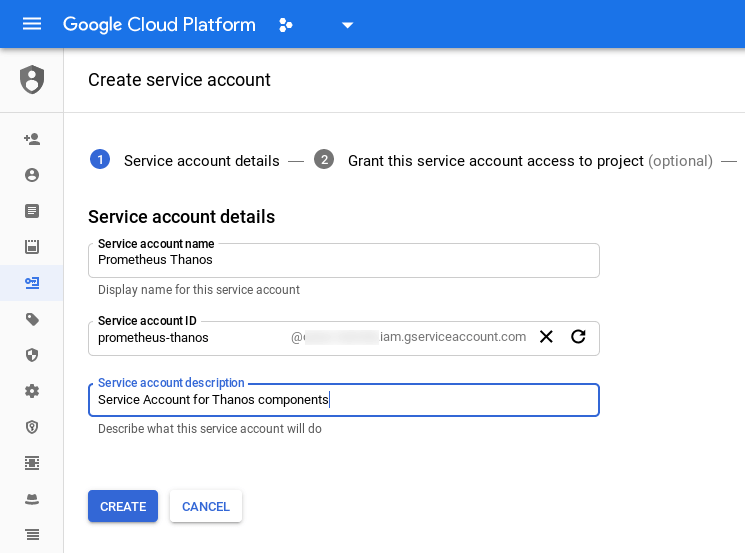
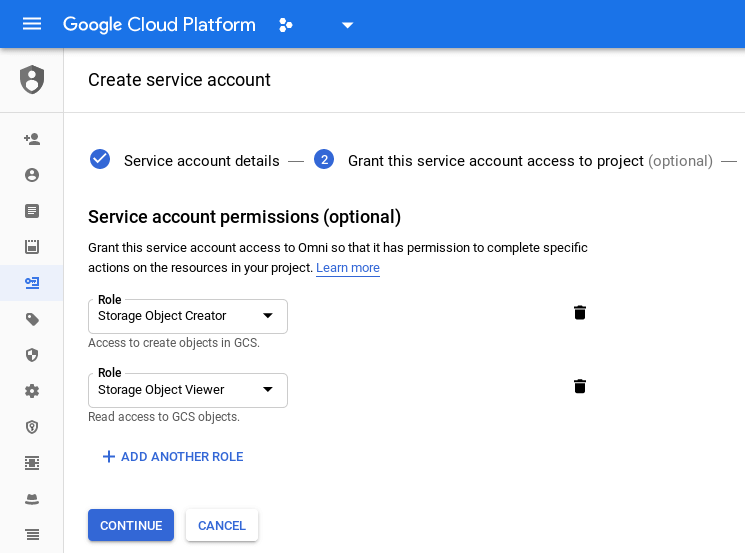
- Generate a new key for the Service Account and download the JSON file. Rename it to
gcs-credentials.json
Creating the secret to store the JSON
The JSON file we downloaded from last step is used to create the secret in the Kubernetes cluster. We will deploy all the components in the namespace monitoring, so let’s create that first.
# Create the monitoring namespace
$ kubectl create namespace monitoring
namespace/monitoring created

# Create the secret
$ kubectl create secret generic gcs-credentials --from-file=gcs-credentials.json -n monitoring
secret/gcs-credentials created
How to deploy Prometheus plus Thanos setup for high availability?
Now we will deploy the Prometheus plus Thanos setup. In order to scrape all the Pods from different namespaces, we will have to create RBAC rules as well.
# RBAC for Prometheus
$ kubectl -n monitoring create -f prometheus/prometheus-rbac.yaml
serviceaccount/prometheus-server created
clusterrole.rbac.authorization.k8s.io/prometheus-server created
clusterrolebinding.rbac.authorization.k8s.io/prometheus-server created

# Deploy Prometheus + Thanos sidecar
$ kubectl -n monitoring create -f thanos/kube/manifests/prometheus-gcs.yaml
statefulset.apps/prometheus-gcs created
configmap/prometheus-config-gcs created
service/prometheus-gcs created
service/thanos-peers created

# Deploy Thanos Query
$ kubectl -n monitoring create -f thanos/kube/manifests/thanos-query.yaml
deployment.apps/thanos-query created
service/thanos-query created

# Deploy Thanos Storage
$ kubectl -n monitoring create -f thanos/kube/manifests/thanos-store.yaml
statefulset.apps/thanos-store created

# Check the components
$ kubectl get pods -n monitoring
NAME                            READY     STATUS    RESTARTS   AGE
prometheus-gcs-0                2/2       Running   1          33s
prometheus-gcs-1                2/2       Running   1          13s
thanos-query-7b46444599-29txn   1/1       Running   0          19s
thanos-query-7b46444599-qsld4   1/1       Running   0          19s
thanos-store-0                  1/1       Running   0          11s
Deploying the application
This will create a deployment ‘mockemtrics’. It generates few metrics with random values.
$ kubectl create -f mockmetrics-deployment.yaml
deployment.apps/mockmetrics created
Creating a load balancer
Now we have two clusters in different regions with an application running on them. There are two Prometheus instances on each cluster which are scraping the metrics from our application. Let’s create a single end point, which can be used with Grafana etc.
thanos-query service is running as NodePort in both the clusters at port 30909. We will create a load balancer pointing to the node pools of both the clusters.
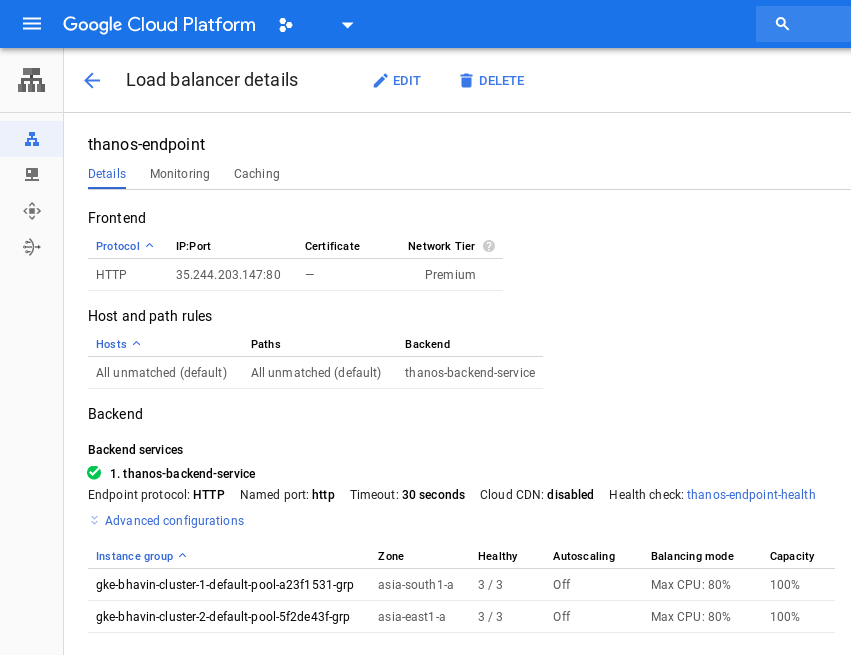 accessing Thanos
Visiting the load balancer IP at port 80 will show us the Thanos UI. Tools relying on Prometheus API endpoint can use this IP.
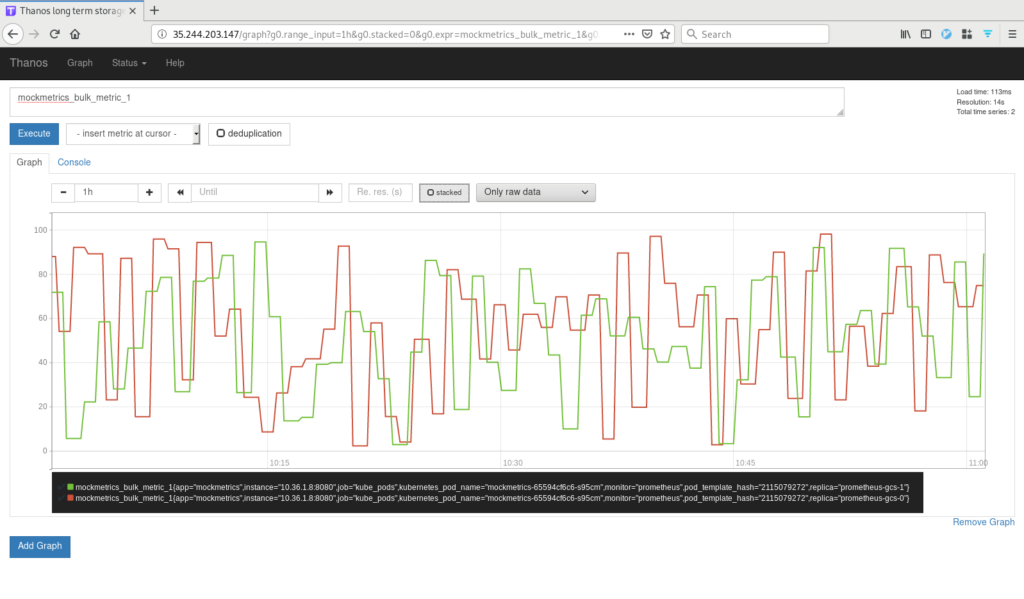 Data from two instances of Prometheus
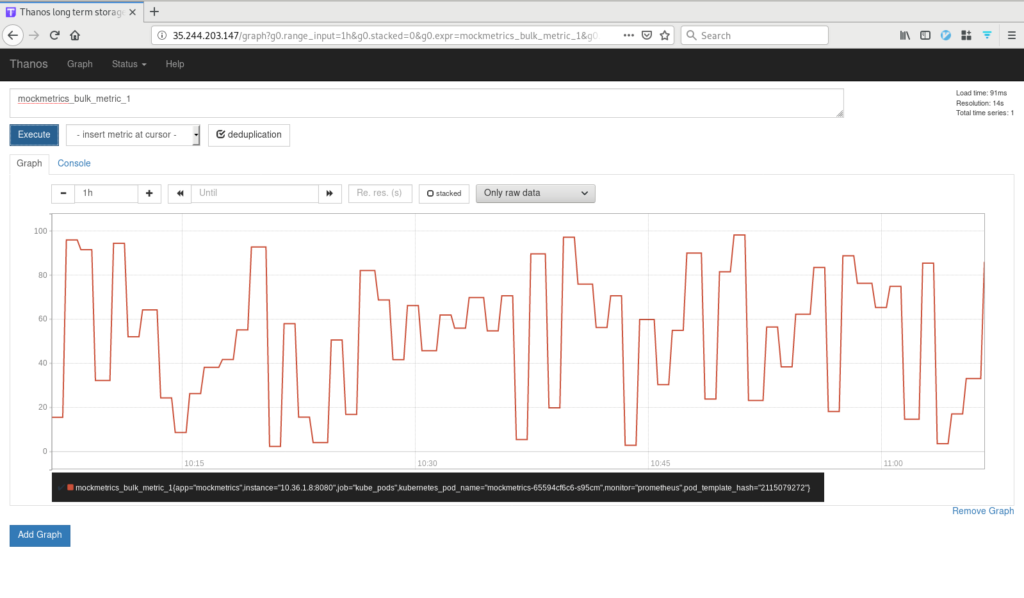 Deduplicated view of data
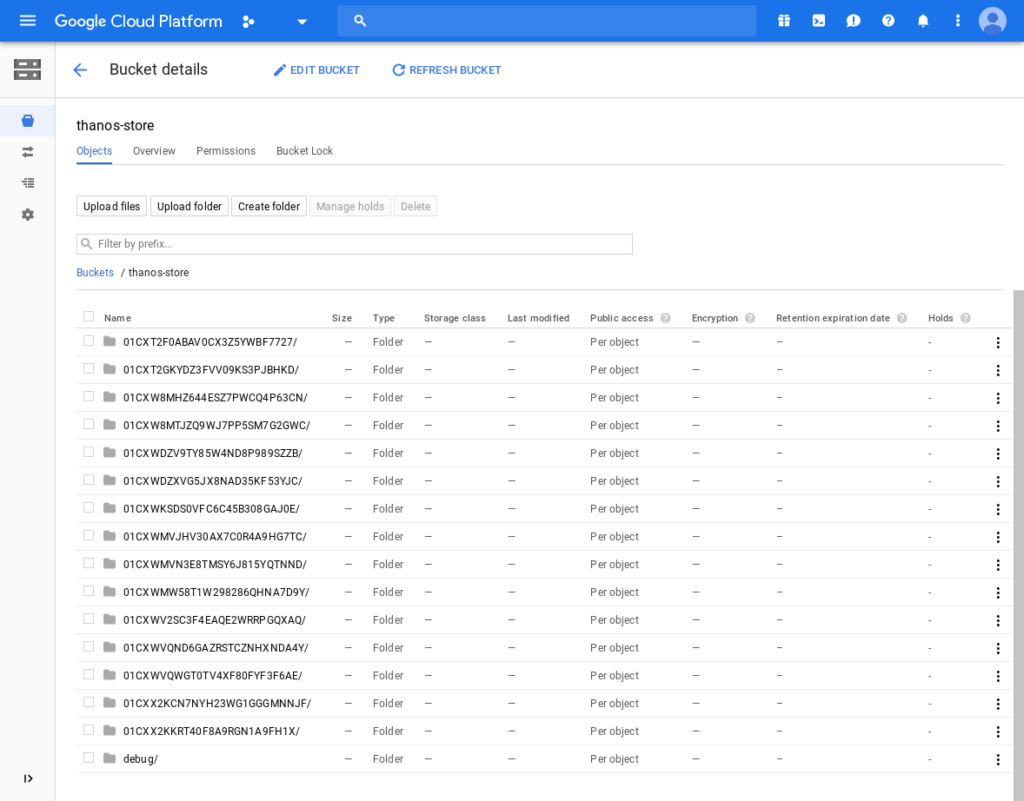 Storage Bucket
Conclusion
Thanos provides a economical, yet scalable way to aggregate data from multiple Prometheus clusters and provides a single pane of glass to users. The project has a lot of promise and makes scaling Prometheus clusters really easy. Hope you enjoyed the process of making Prometheus highly available and scalable with Thanos. Follow us on Twitter and LinkedIn for regular posts like this.
Looking for help with observability stack implementation and consulting? do check out how we’re helping startups & enterprises as an observability consulting services provider and Prometheus enterprise support provider.
References & further reading
- Thanos’ design doc: Cost comparison
- Modified manifests used for deploying Prometheus and Thanos
- Thanos Github
Stay updated with latest in AI and Cloud Native tech
We hate 😖 spam as much as you do! You're in a safe company.
Only delivering solid AI & cloud native content.
Posts You Might Like